




Bitcoin (BTC) heads into September still battling key resistance as markets flip hawkish on Federal Reserve policy.
Key points:
- Markets see a 60% chance of the Fed hiking interest rates in September, with jobs data due this week.
- Oil has experienced renewed volatility amid fresh US strikes on Iran and an unprecedented US-Venezuela oil-supply deal.
- Bitcoin remains under a crucial patch of resistance below $86,000 heading into the August monthly candle close.
September rate hike bets return after Jackson Hole
The coming week will bring the release of multiple US employment indexes, each likely to shape expectations for policy changes from the Federal Reserve.
The Fed is already in the spotlight after last week’s Jackson Hole economic symposium, which featured its first keynote speech from new chair Kevin Warsh. Warsh remained characteristically tight-lipped on policy cues, describing forward guidance — a fixture of Fed PR for decades — as having “overstayed its welcome.”
On inflation, Warsh described current data as too high, despite July’s lower-than-expected results for the Consumer Price Index (CPI) and Personal Consumption Expenditures (PCE) index.
“Each of these broad inflation measures have fallen significantly from their highs of a few years ago, but progress through the past couple of years has been more modest, and while this summer’s PCE and CPI readings were better than expected, they do not tell me that underlying trends have meaningfully improved,” he said.
Markets responded with increased expectations of interest-rate hikes, reverting to majority odds for a 0.25% hike at the Fed’s September meeting, per data from CME Group’s FedWatch Tool. At the time of writing, these odds stand at just below 60%, up from 41.4% last week.
Fed target-rate probability comparison for September FOMC meeting (screenshot). Source: CME Group
Rates expectations could be tempered, however, by labor-market numbers. Friday will see August nonfarm payrolls data released. The economy is expected to have added 50,000 jobs last month, compared to a loss of 23,000 in June.
Private-sector employment numbers will precede nonfarm payrolls on Wednesday, followed by initial jobless claims on Thursday.
“All eyes are on the labor market,” trading resource The Kobeissi Letter summarized in commentary on X, noting that this would form the last slew of jobs data before the September rate decision.
Kobeissi flagged major downward revisions to employment numbers, with weak labor-market conditions forming a potential hurdle to Fed policy tightening. Citing data from the Bureau of Labor Statistics (BLS), it reported another 79,000 jobs removed in the 12 months through March this year.
“This follows last year’s record -911,000 revision and marks the 4th consecutive annual downward adjustment, matching the streak that ended in 2010 after the 2008 Financial Crisis,” it added, describing the labor market as being “weaker than initially reported for years.”
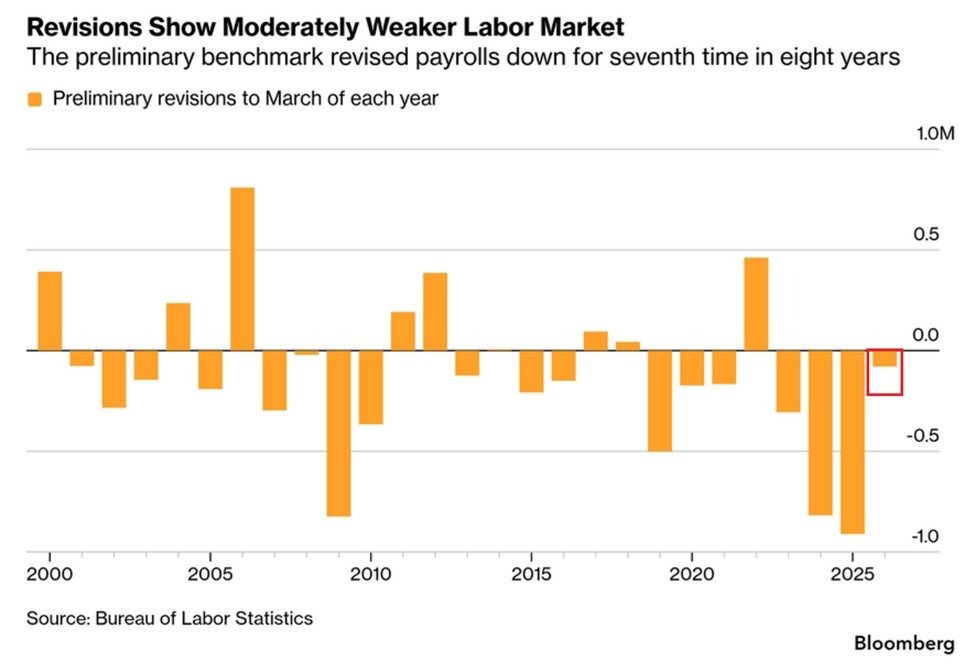
US employment data revisions. Source: The Kobeissi Letter on X.com
Oil spikes on US-Iran escalation
Oil markets are at the forefront of macro volatility as the week begins thanks to a combination of geopolitical catalysts.
Renewed US strikes on Iran sent Brent crude back above $90 per barrel on Monday, nearing its highest levels in a week. US WTI crude passed $85 per barrel, and was up 2.5% on the day at the time of writing.
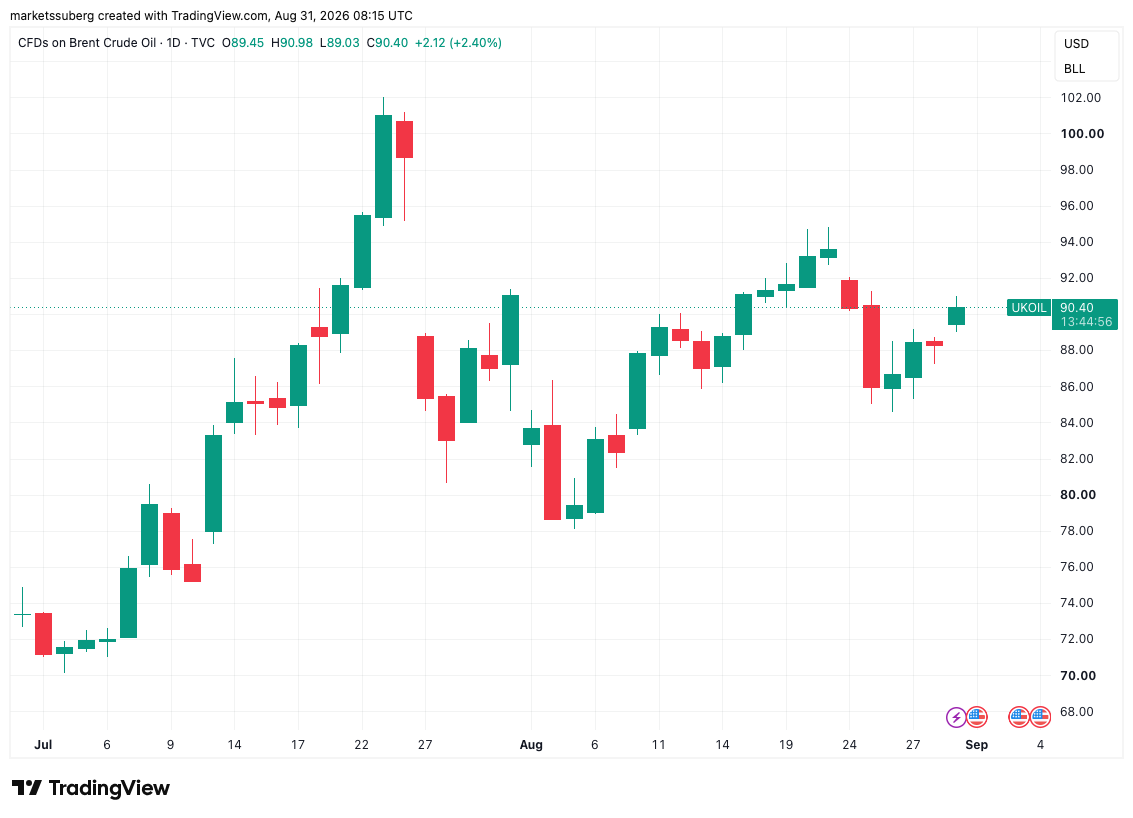
CFDs on Brent crude oil one-day chart. Source: Cointelegraph/TradingView
European stocks came under pressure as a result of the events, with Germany’s DAX down 0.7%. US president Donald Trump implied that Iran’s Kharg Island oil hub was once more a target. In a post on Truth Social, Trump uploaded an AI-generated video that appeared to show the bombing of oil infrastructure, describing the island as “being blown to smithereens.”
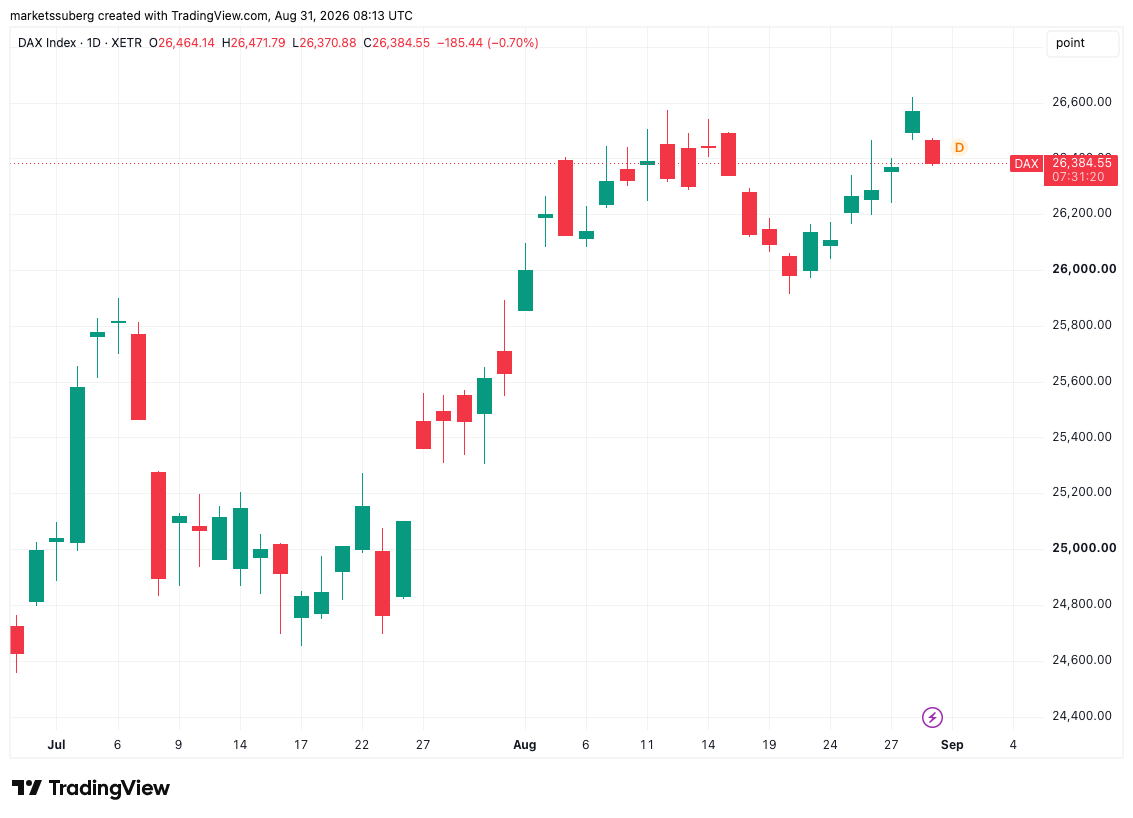
DAX one-day chart. Source: Cointelegraph/TradingView
The strikes followed news of a major energy deal granting the US significant control of Venezuela’s oil reserves. Numbers from Venezuela’s interim president Delcy Rodriguez quoted by CNBC and others referenced a daily oil-output target of 1.5 million barrels, with total reserves involved at 65 billion barrels, currently worth around $5.4 trillion.
In a Truth Social post, Trump described the takeover as the “biggest oil deal in history.”
Bitcoin battles multiple 50-week trend lines
Bitcoin saw late sell pressure into Sunday’s weekly close, with a brief trip below its 50-week exponential moving average (EMA) at $77,269, per data from TradingView.
Price defended the trend line, which we had previously flagged as important support, for a second consecutive week. In the wake of its recent rally, BTC had managed to reclaim the moving average with a weekly close for the first time since November 2025.
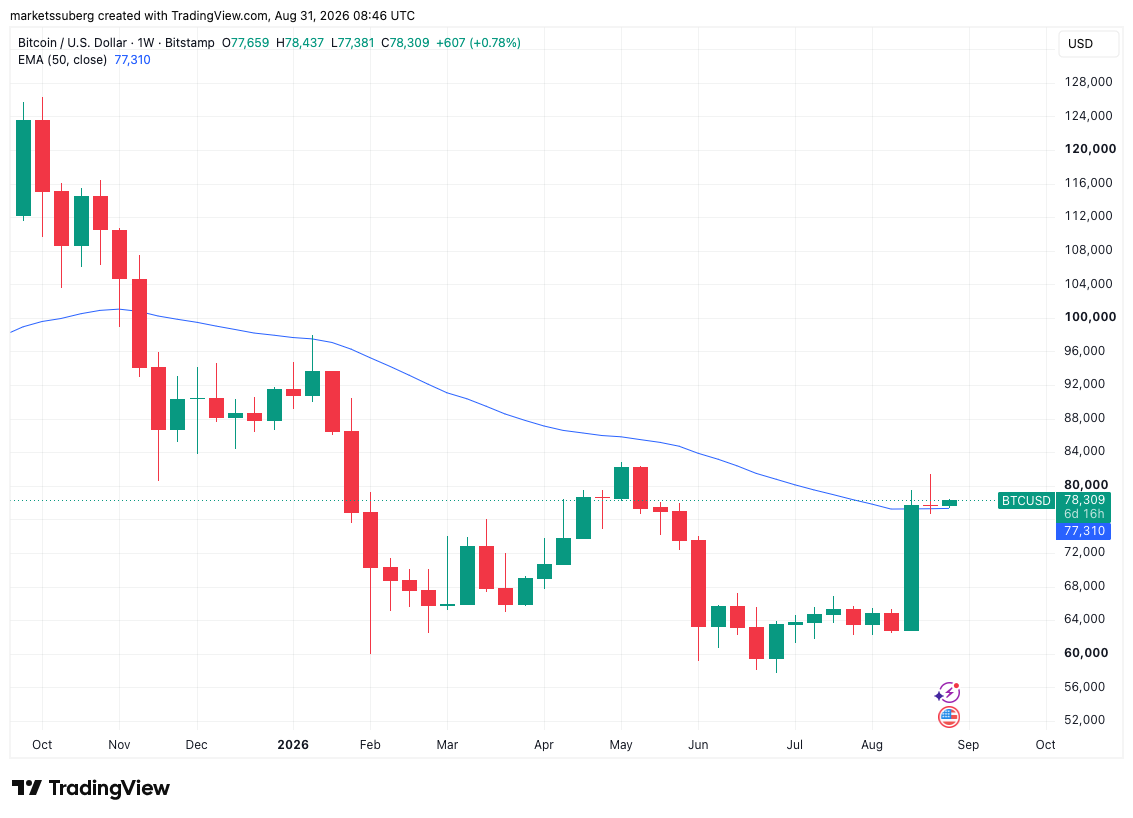
BTC/USD one-week chart with 50 EMA. Source: Cointelegraph/TradingView
In his latest market observations on X, Rafael Schultze-Kraft, cofounder of crypto analytics platform Glassnode, drew attention to the equivalent simple moving average (SMA) at $80,307. Here, BTC/USD still lacks a reclaim on the weekly time frame — something which has preceded additional price upside in the past, he showed.
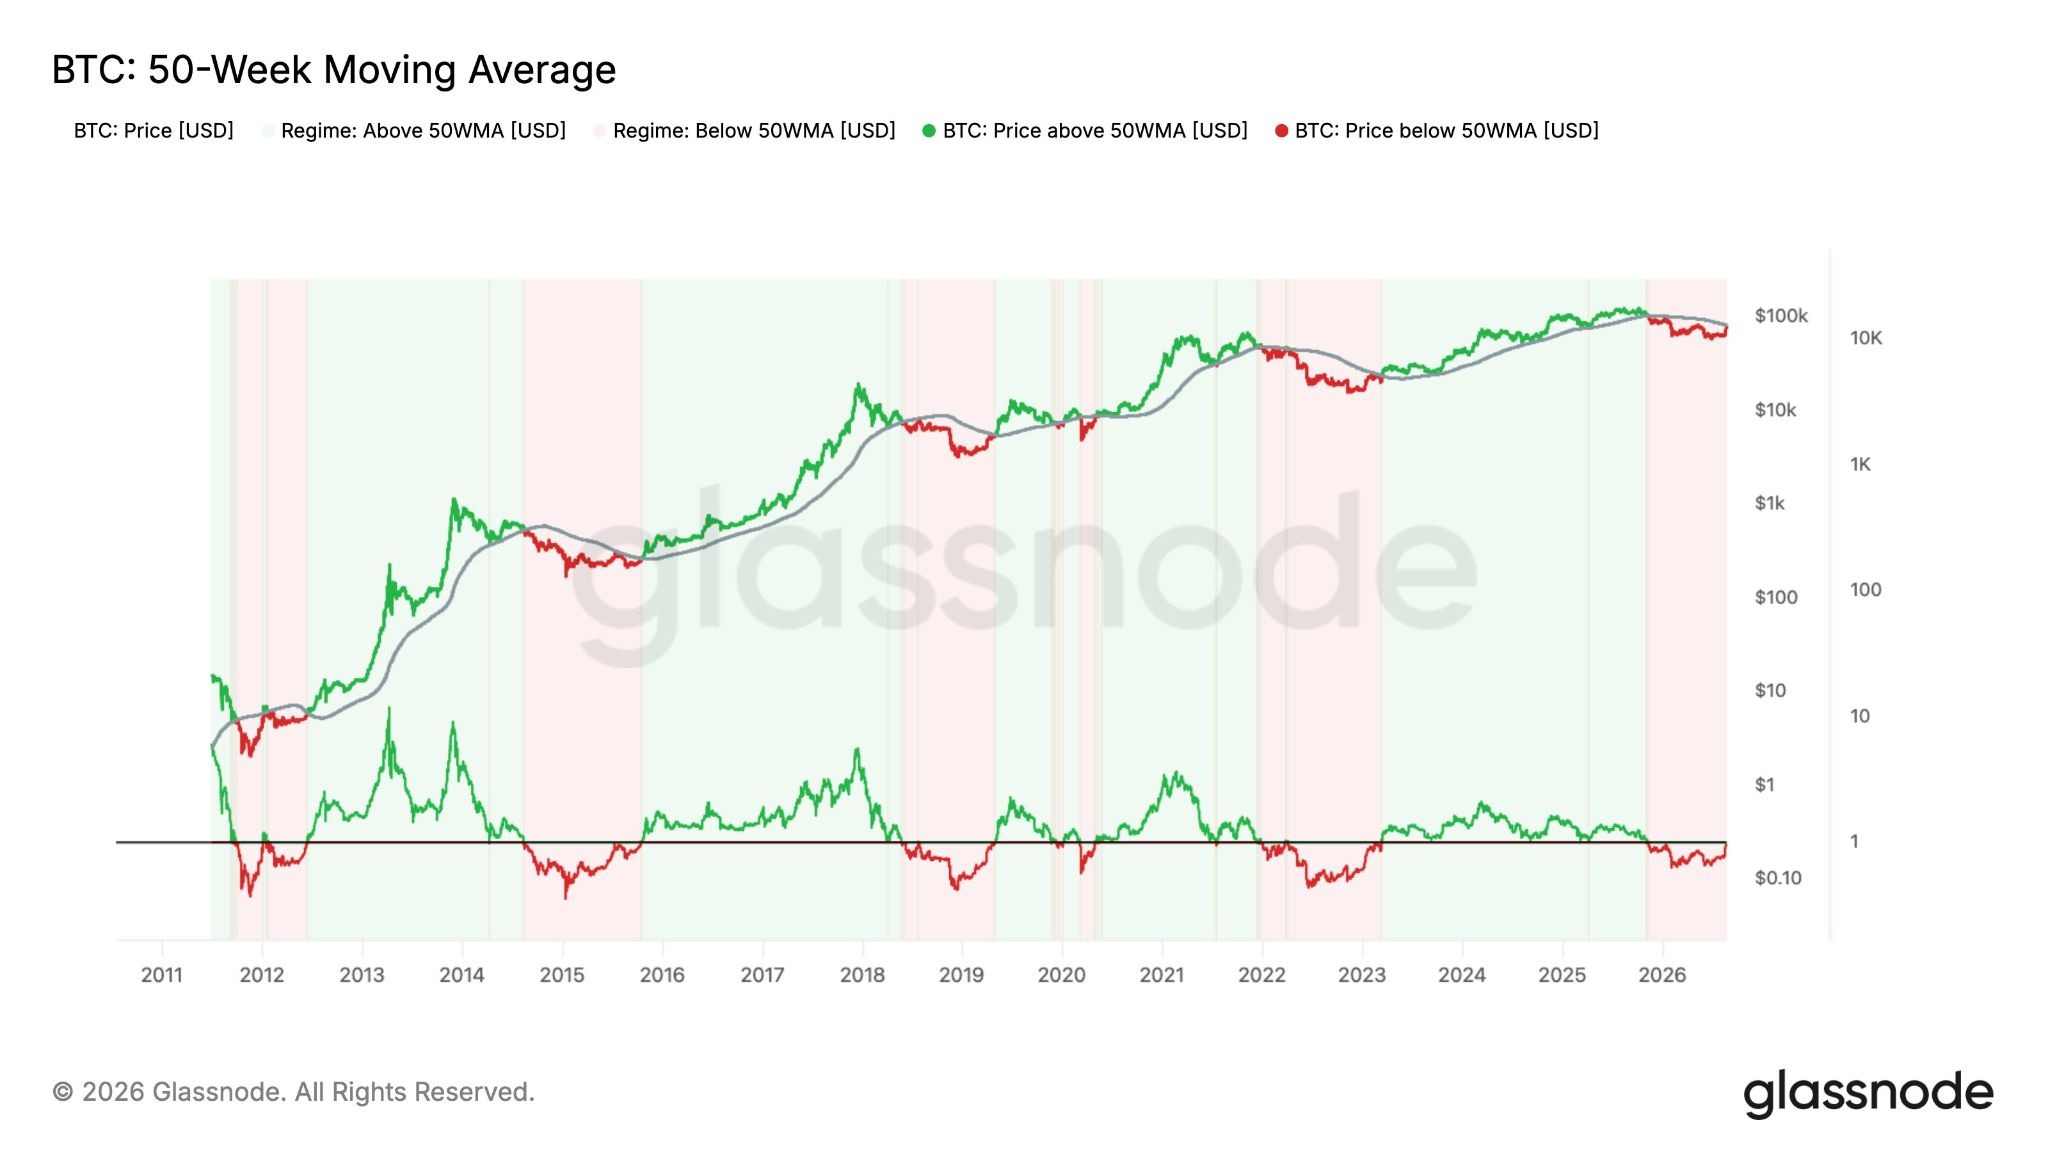
BTC/USD chart with periods above and below 50-week SMA. Source: Rafael Schultze-Kraft on X.com
Monthly close faces stiff resistance
Heading into the August monthly close, Bitcoin bulls face a key test as monthly gains for BTC/USD hover near 25%.
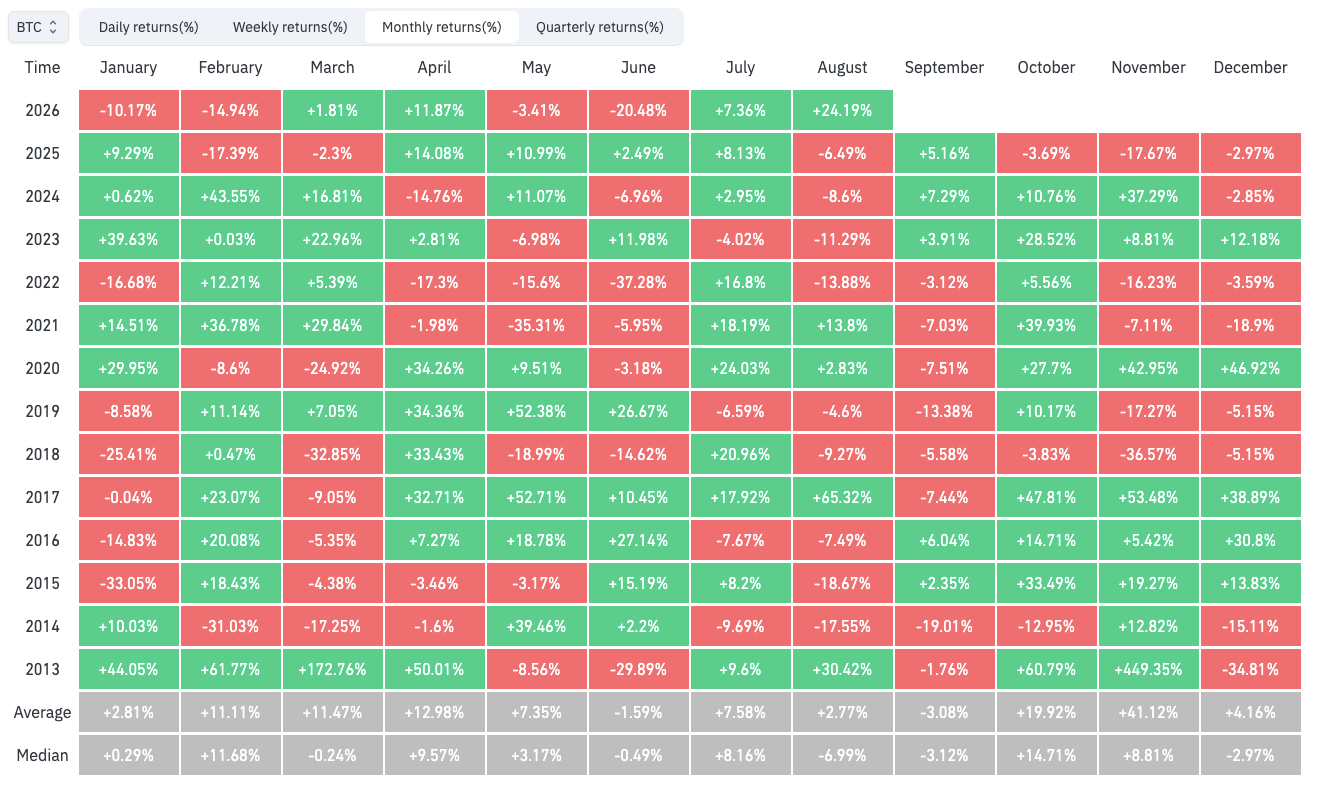
BTC/USD monthly returns (screenshot). Source: CoinGlass
Despite the biggest crypto short liquidation event ever recorded, buyers have so far failed to reclaim key resistance above $80,000, analysis warns.
“Bitcoin is still hovering beneath the Macro Downtrending resistance, having upside wicked briefly beyond it,” trader and analyst Rekt Capital summarized about the current status quo in his latest analysis on X.
“Still the pivotal resistance and by staying below it, Bitcoin continues its series of Macro Lower Highs.”
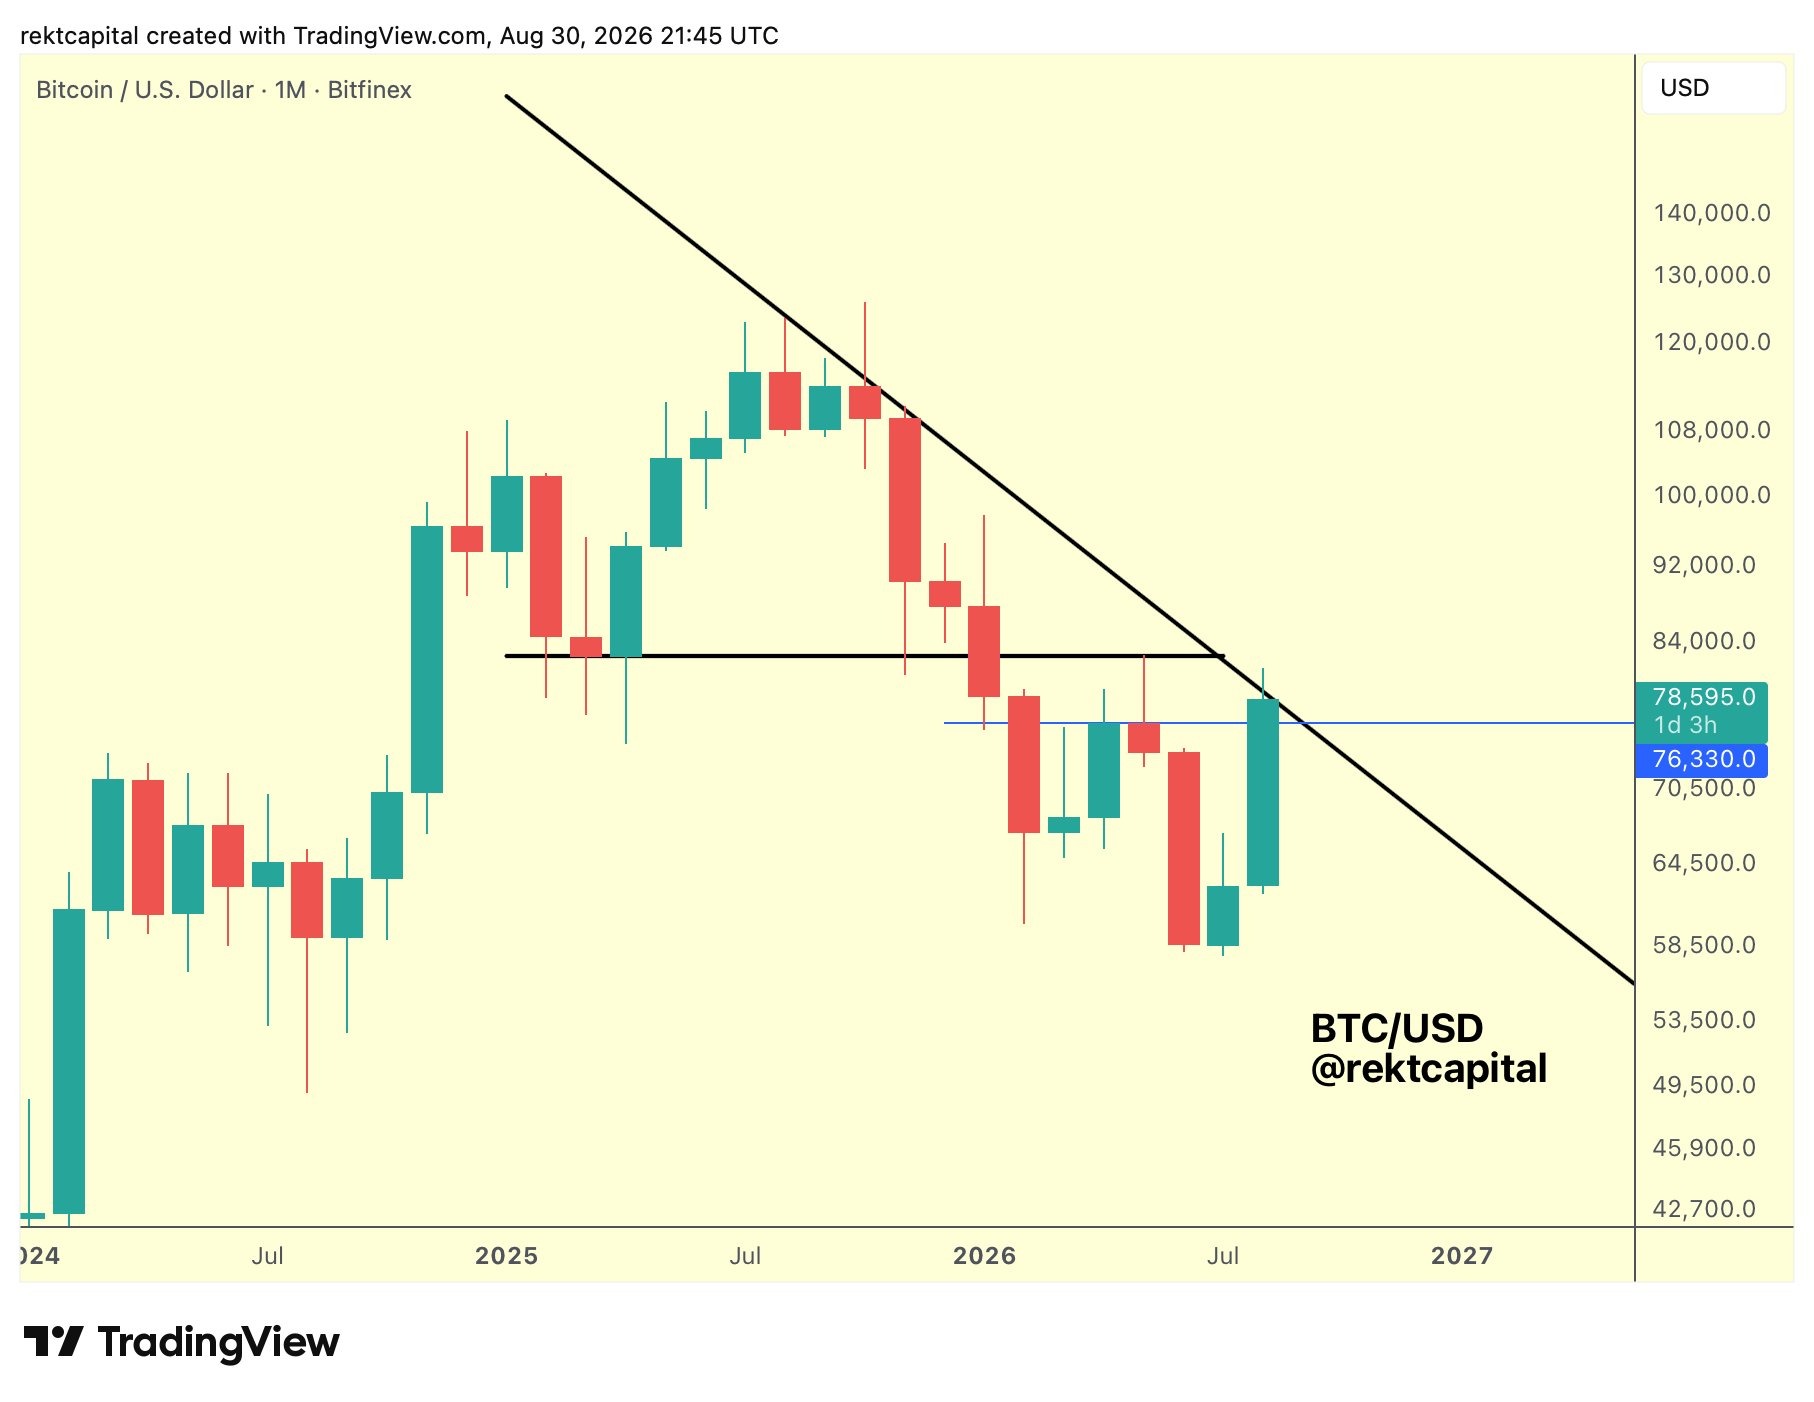
BTC/USD one-month chart. Source: Rekt Capital on X.com
Rekt Capital argued that a breakout above this resistance would have major implications for the four-year BTC price cycle, as it would mean that its latest bear market would be shorter than those before it.
Beyond the trend line, however, additional resistance has already formed thanks to thickening ask liquidity on exchange order books. As Cointelegraph reported, this extends to $86,000, thus requiring even more buy-side momentum to effect a lasting breakout.
“Every overhead structure we track now sits between $81K and $86K; that band is where the recovery’s demand meets its test,” Glassnode wrote in research last week.
Larger buyers seen as pivotal to BTC price upside
Glassnode calculated that 1.05 million BTC owned by long-term holders have a cost basis between $83,000 and $86,000. Long-term holders refer to wallets holding a given amount of BTC without selling for six months or more.
Related: Supply absorption ‘key question’ as Bitcoin fails to reclaim $80K: Analysis
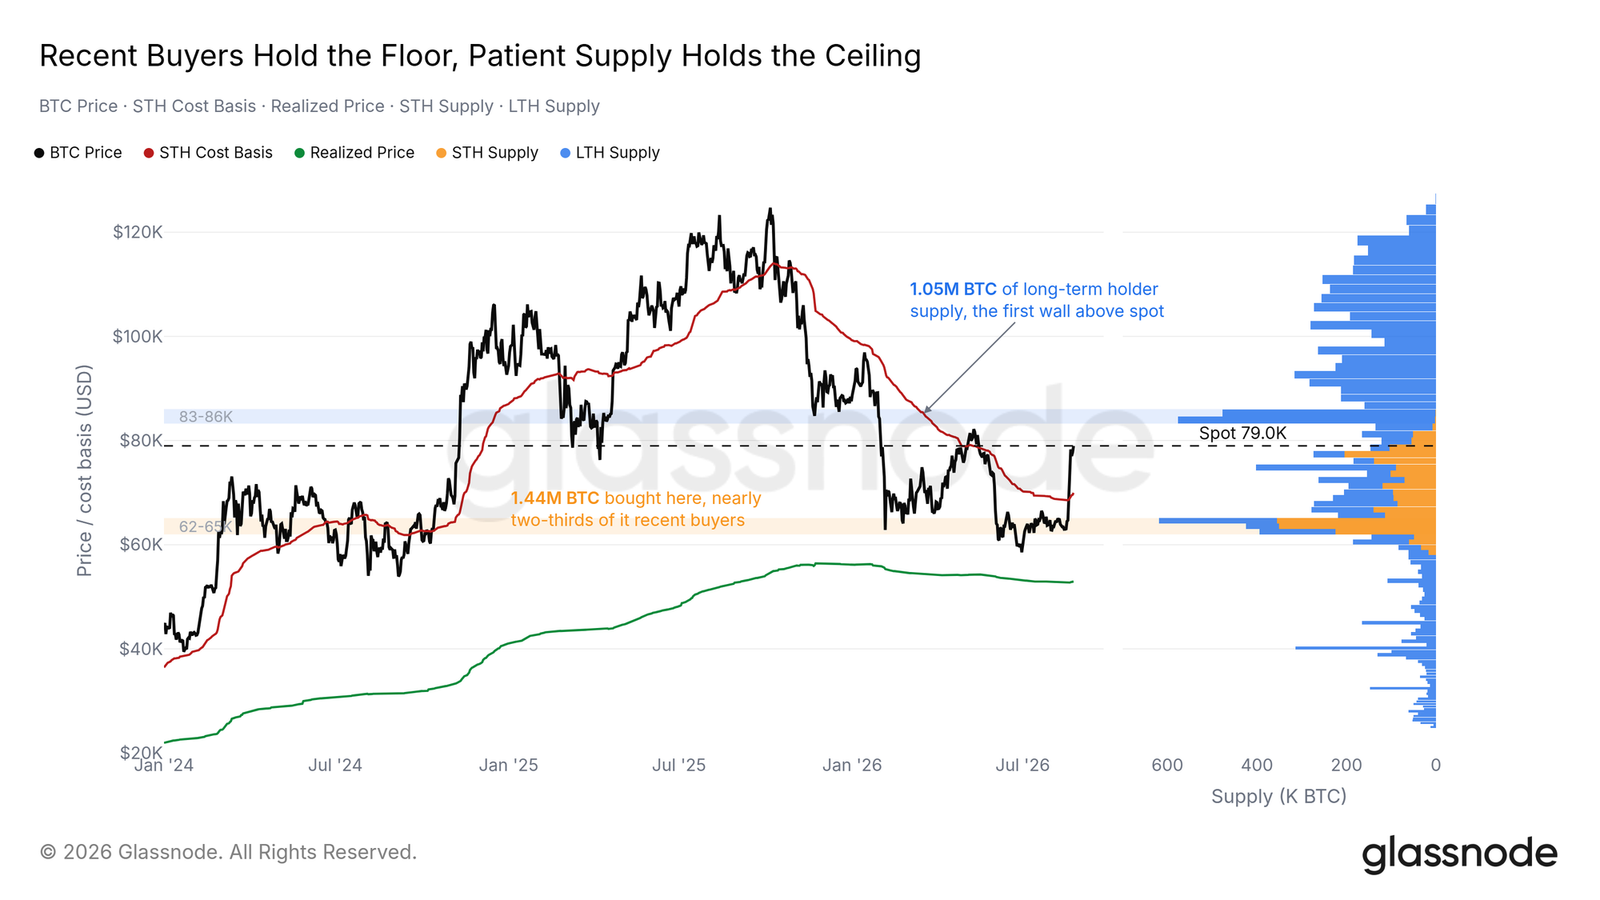
BTC supply distribution by wallet cohort. Source: Glassnode
In additional findings this week, onchain analytics platform CryptoQuant drew attention to the potential impact of large-volume investors going into September. These entities, its data showed, were behind buyer appetite this month, while smaller investors took profit or exited the market after their holdings returned to breakeven.
“From 1–30 August, wallets with 100+ BTC added about 60,000 BTC. Wallets with 1–100 BTC sold about 33,000. Wallets under 1 BTC sold about 14,000,” it wrote in a blog post on Monday.
“That split is the month. Large holders absorbed the breakout. Smaller holders used the rally as an exit.”
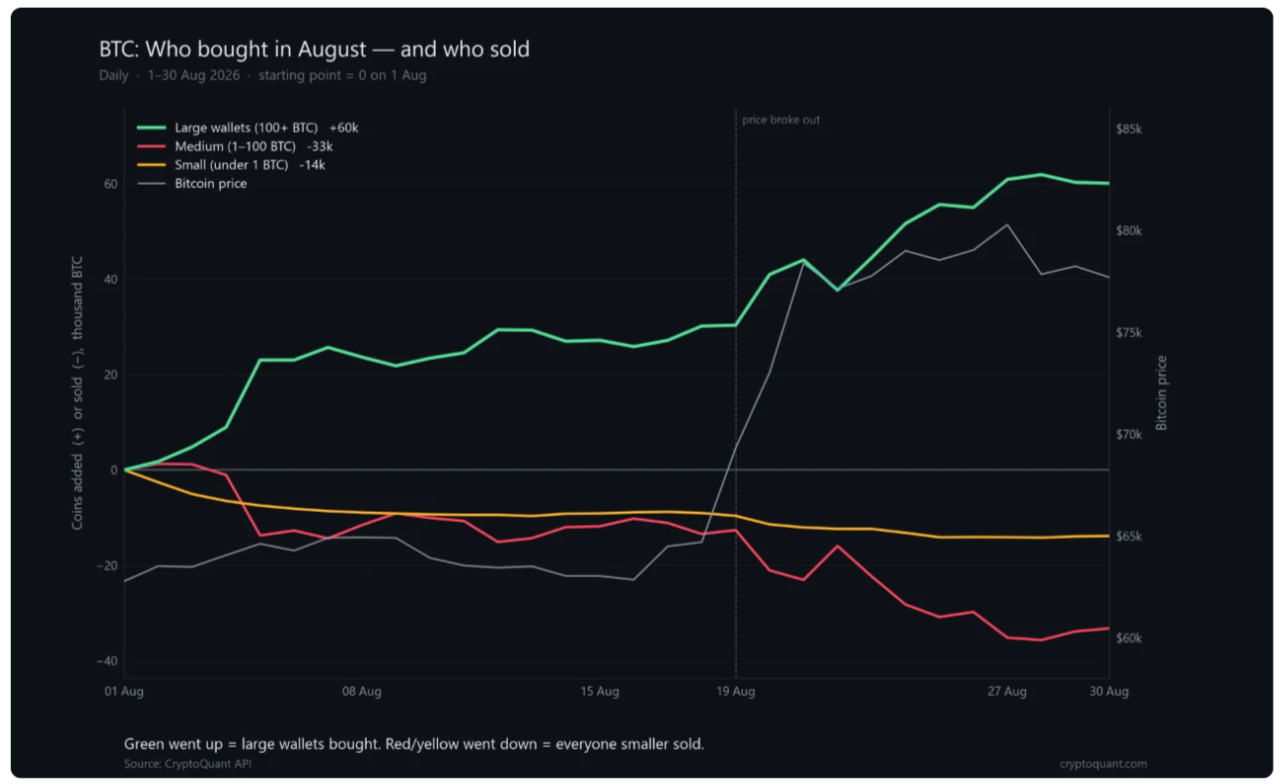
Bitcoin accumulation data by wallet cohort (screenshot). Source: CryptoQuant
CryptoQuant added that the view of large-investor accumulation would require reassessment should those entities start selling recently acquired supply below $80,000.
Read the full article here