





Bitcoin (BTC) spiked past $64,000 into Tuesday’s Wall Street open as US inflation saw a surprise sudden downturn.
Key points:
- Bitcoin returns to near the top of its local trading range on US inflation data.
- The biggest drop in CPI since April 2020 boosts crypto and risk assets.
- Traders remain in wait-and-see mode over whether local resistance will break.
US CPI ignores Iran pressure with snap drop
Data from TradingView showed BTC/USD gaining more than 2% on the day as the June print of the Consumer Price Index (CPI) came in below expectations.
BTC/USD one-hour chart. Source: Cointelegraph/TradingView
At 3.5% versus the anticipated 3.8%, CPI posted its largest monthly decline since April 2020, per data from US Bureau of Labor Statistics (BLS). Energy led the drop despite headwinds from the US-Iran war and the closure of the Strait of Hormuz oil route.
“The index for energy fell 5.7 percent in June after rising 3.9 percent in May, 3.8 percent in April, and 10.9 percent in March,” an official news release stated.
“The energy index was the largest contributor to the monthly all items decrease, more than offsetting increases in other indexes including those for shelter and food.”
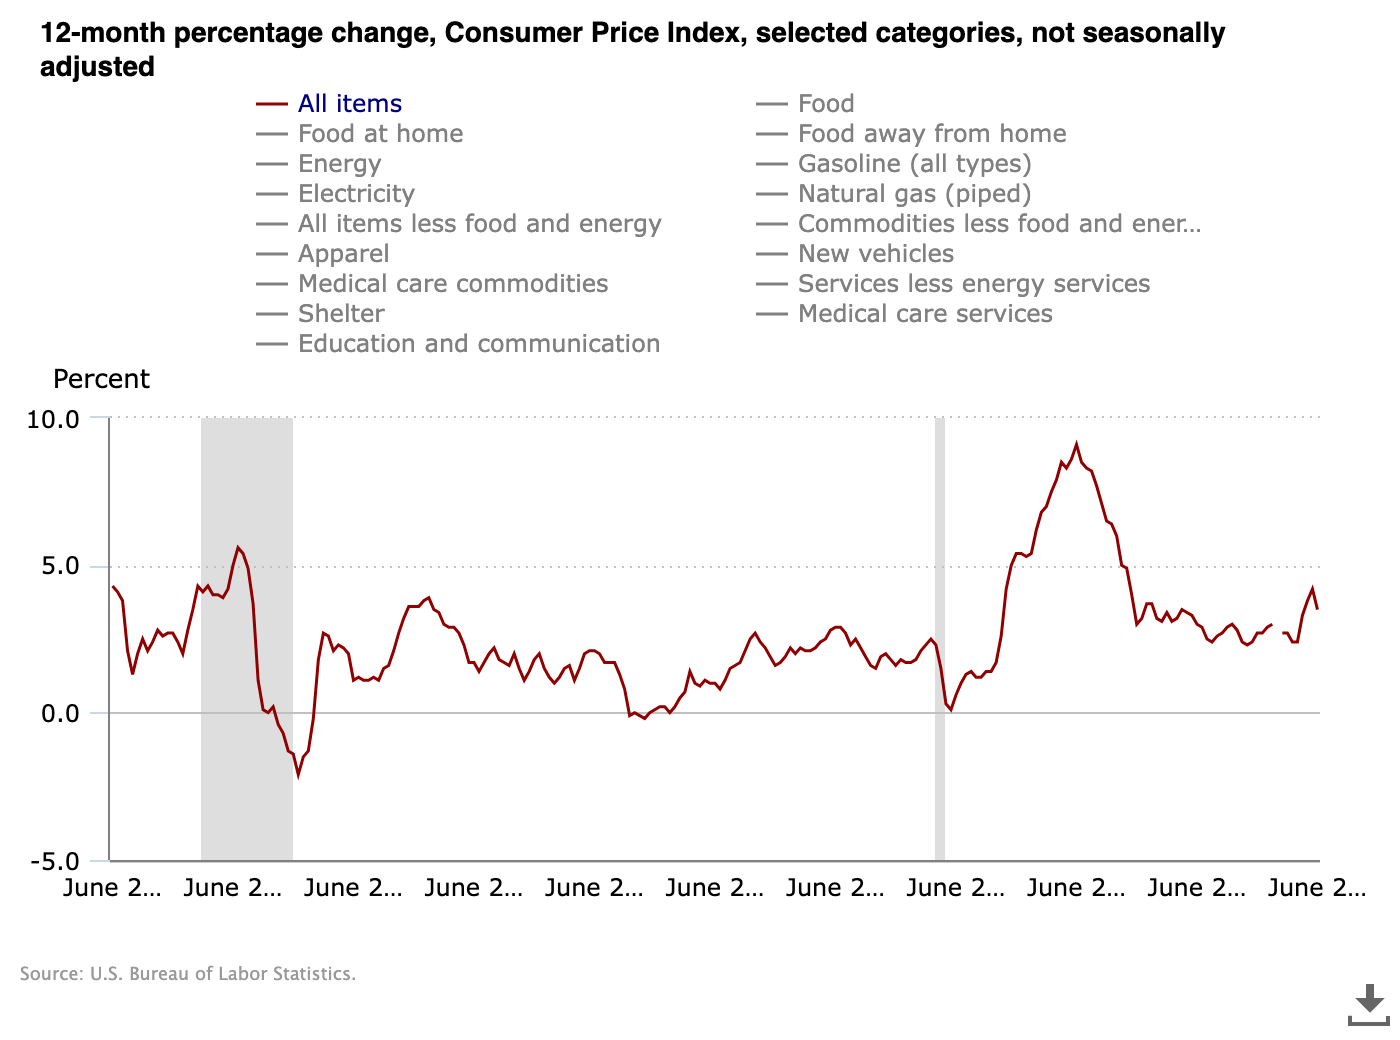
US CPI 12-month % change. Source: BLS
Risk assets reacted positively, with US stocks in the green and crypto showing particular relief.
Market expectations of future Federal Reserve financial policy changes also turned dovish, with the odds of interest-rate hikes dropping sharply. The latest data from CME Group’s FedWatch Tool nonetheless maintained consensus for a 0.25% hike at the Fed’s September meeting.
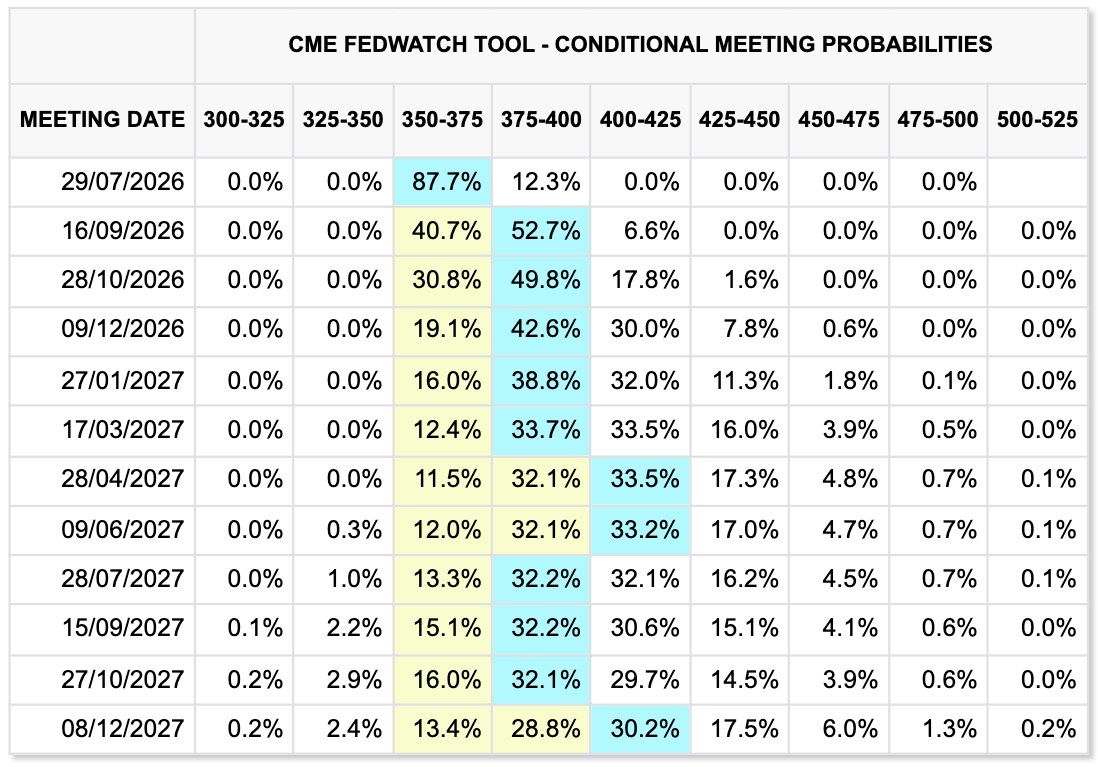
Fed target rate probabilities (screenshot). Source: CME Group
“This print should help temper what had become an excessively hawkish market tilt to the monetary policy outlook,” economist Mohamed El-Erian wrote in a response on X.
Trader warns of BTC price rejection
Bitcoin traders remained cautious with local resistance above $64,000 still in place.
Related: Bitcoin bear market will bottom when two-month RSI metric hits zero, trader predicts
In ongoing market analysis, X commentator Exitpump noted short positions getting “squeezed” as a result of the CPI print.
“Sellers haven’t been able to push price lower because of strong passive demand and now seeing shorts closing out slowly forcing price to grind up,” it summarized.
“Still a range trading environment.”
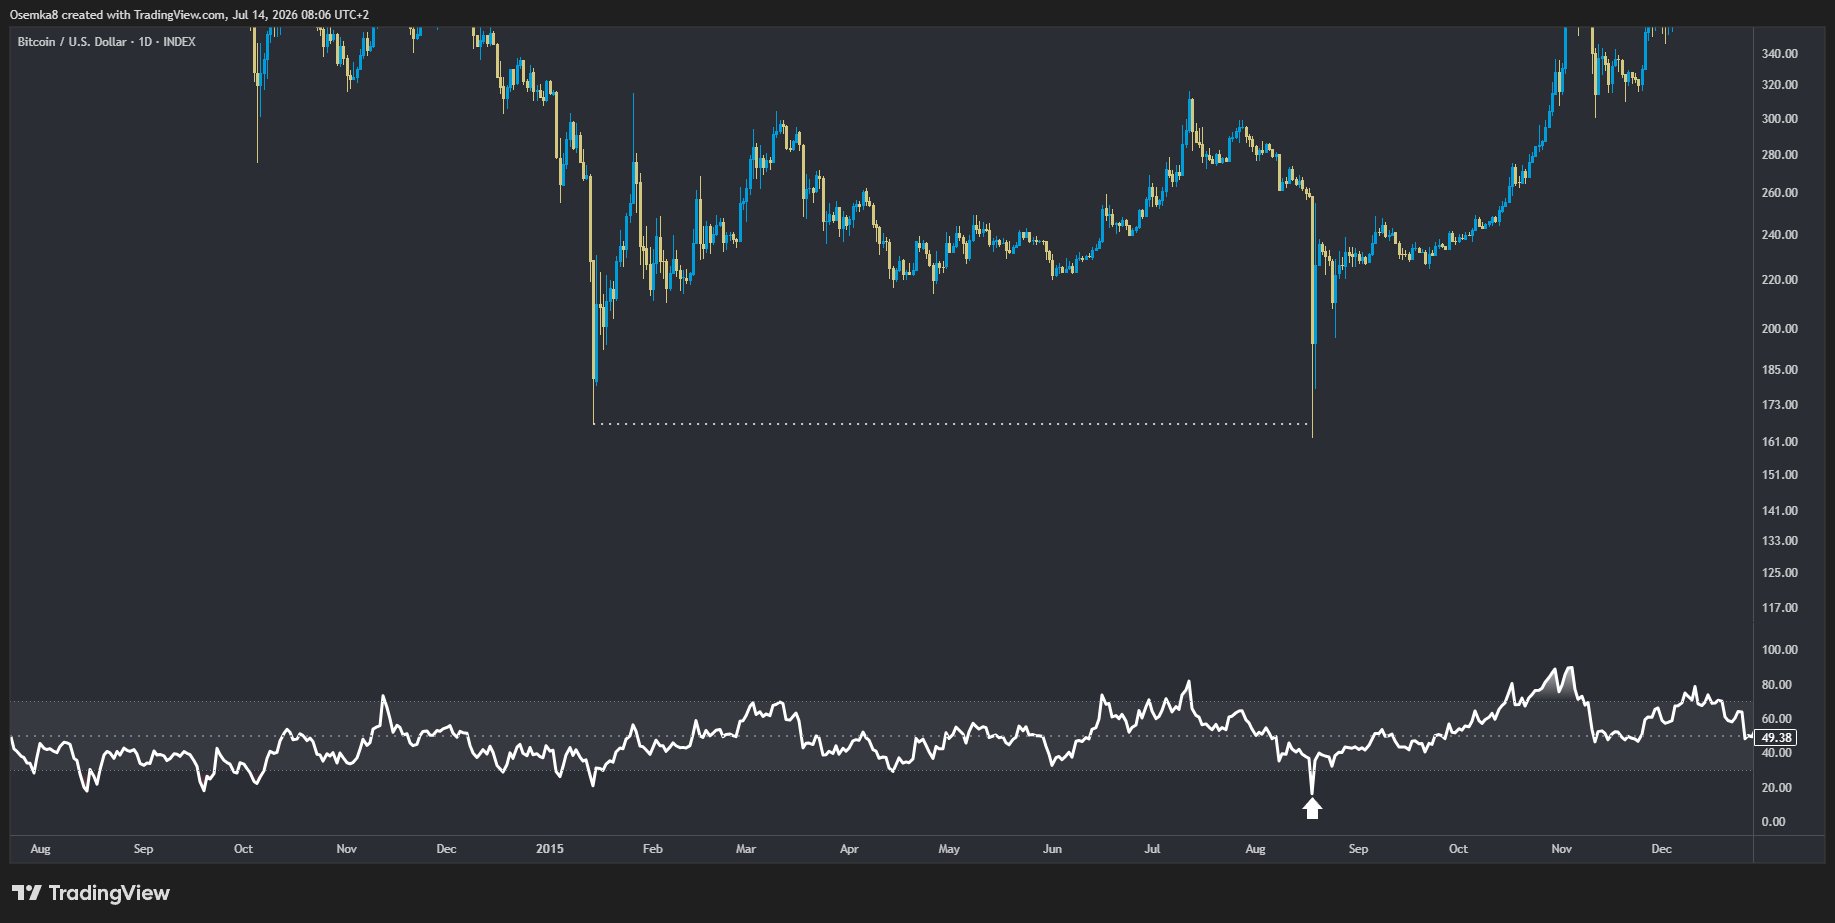
BTC/USD one-day chart. Source: Exitpump/X
The latest data from CoinGlass put 24-hour crypto short liquidations at just over $220 million.
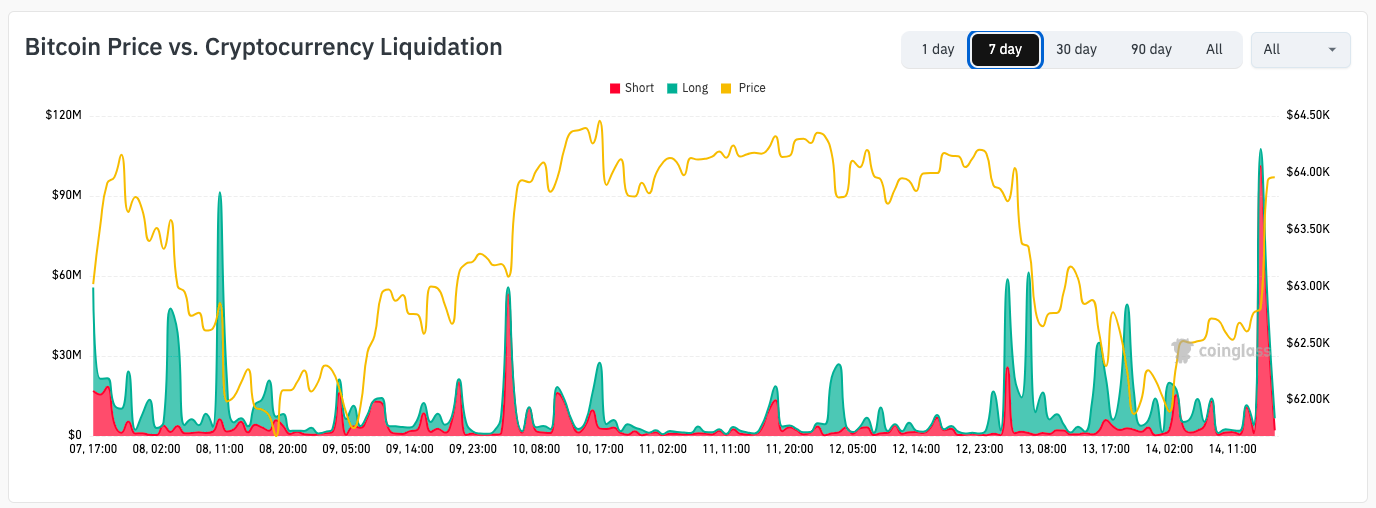
BTC/USD vs. crypto liquidations (screenshot). Source: CoinGlass
Continuing, trader Killa said that they would eye “signs of exhaustion” should the BTC price take out the local highs.
“There’s still a liquidity pool sitting above 64.8K, but right now we’re testing the weekly open. If we can’t reclaim and hold the weekly open, this is likely just a lower high before we move down to test the $60K region,” an X post read.
Read the full article here