


Multiple XRP (XRP) indicators have hinted at a potential 25% relief rally in the coming weeks.
Key takeaways:
- XRP price looks poised to print a rare death cross with a rebound setup toward $1.40.
- XRP may also be forming a broader bottom, eyeing a larger rally toward $8 in the coming months.
XRP’s mean-reversion setup may send price toward $1.40
As of Monday, XRP’s 20-week exponential moving average (20-week EMA, green) near $1.40 was on the verge of crossing below its 200-week EMA (blue) near $1.39.
A confirmed weekly close below the longer-term average would mark a rare death cross between the two trend gauges.
XRP/USD weekly chart. Source: TradingView
In the past, XRP’s previous 20-week/200-week EMA crosses were followed by relief rebounds back toward the 200-week EMA. That includes a roughly 20% recovery in 2019 and a larger 82.7% rebound in 2022.
A similar mean-reversion move this time would put the $1.39–$1.40 area in focus, implying roughly 23%–25% upside by July from XRP’s current price near $1.13.
XRP’s weekly relative strength index, or RSI, was also hovering just above the oversold threshold of 30 on Monday.
The RSI measures whether an asset is becoming overheated or overly sold. Readings near 30 typically suggest that sellers may be running out of momentum, raising the odds of a short-term rebound even if the broader trend remains weak.
XRP shorts create $1.40 price magnet
Binance XRP/USDT liquidation heatmap data further supports the relief-rally setup.
The chart shows a heavier concentration of short liquidation liquidity above the current price than long liquidation liquidity below it. The largest upside cluster, of around $236.5 million, appears around the $1.37–$1.40 zone, according to CoinGlass data.
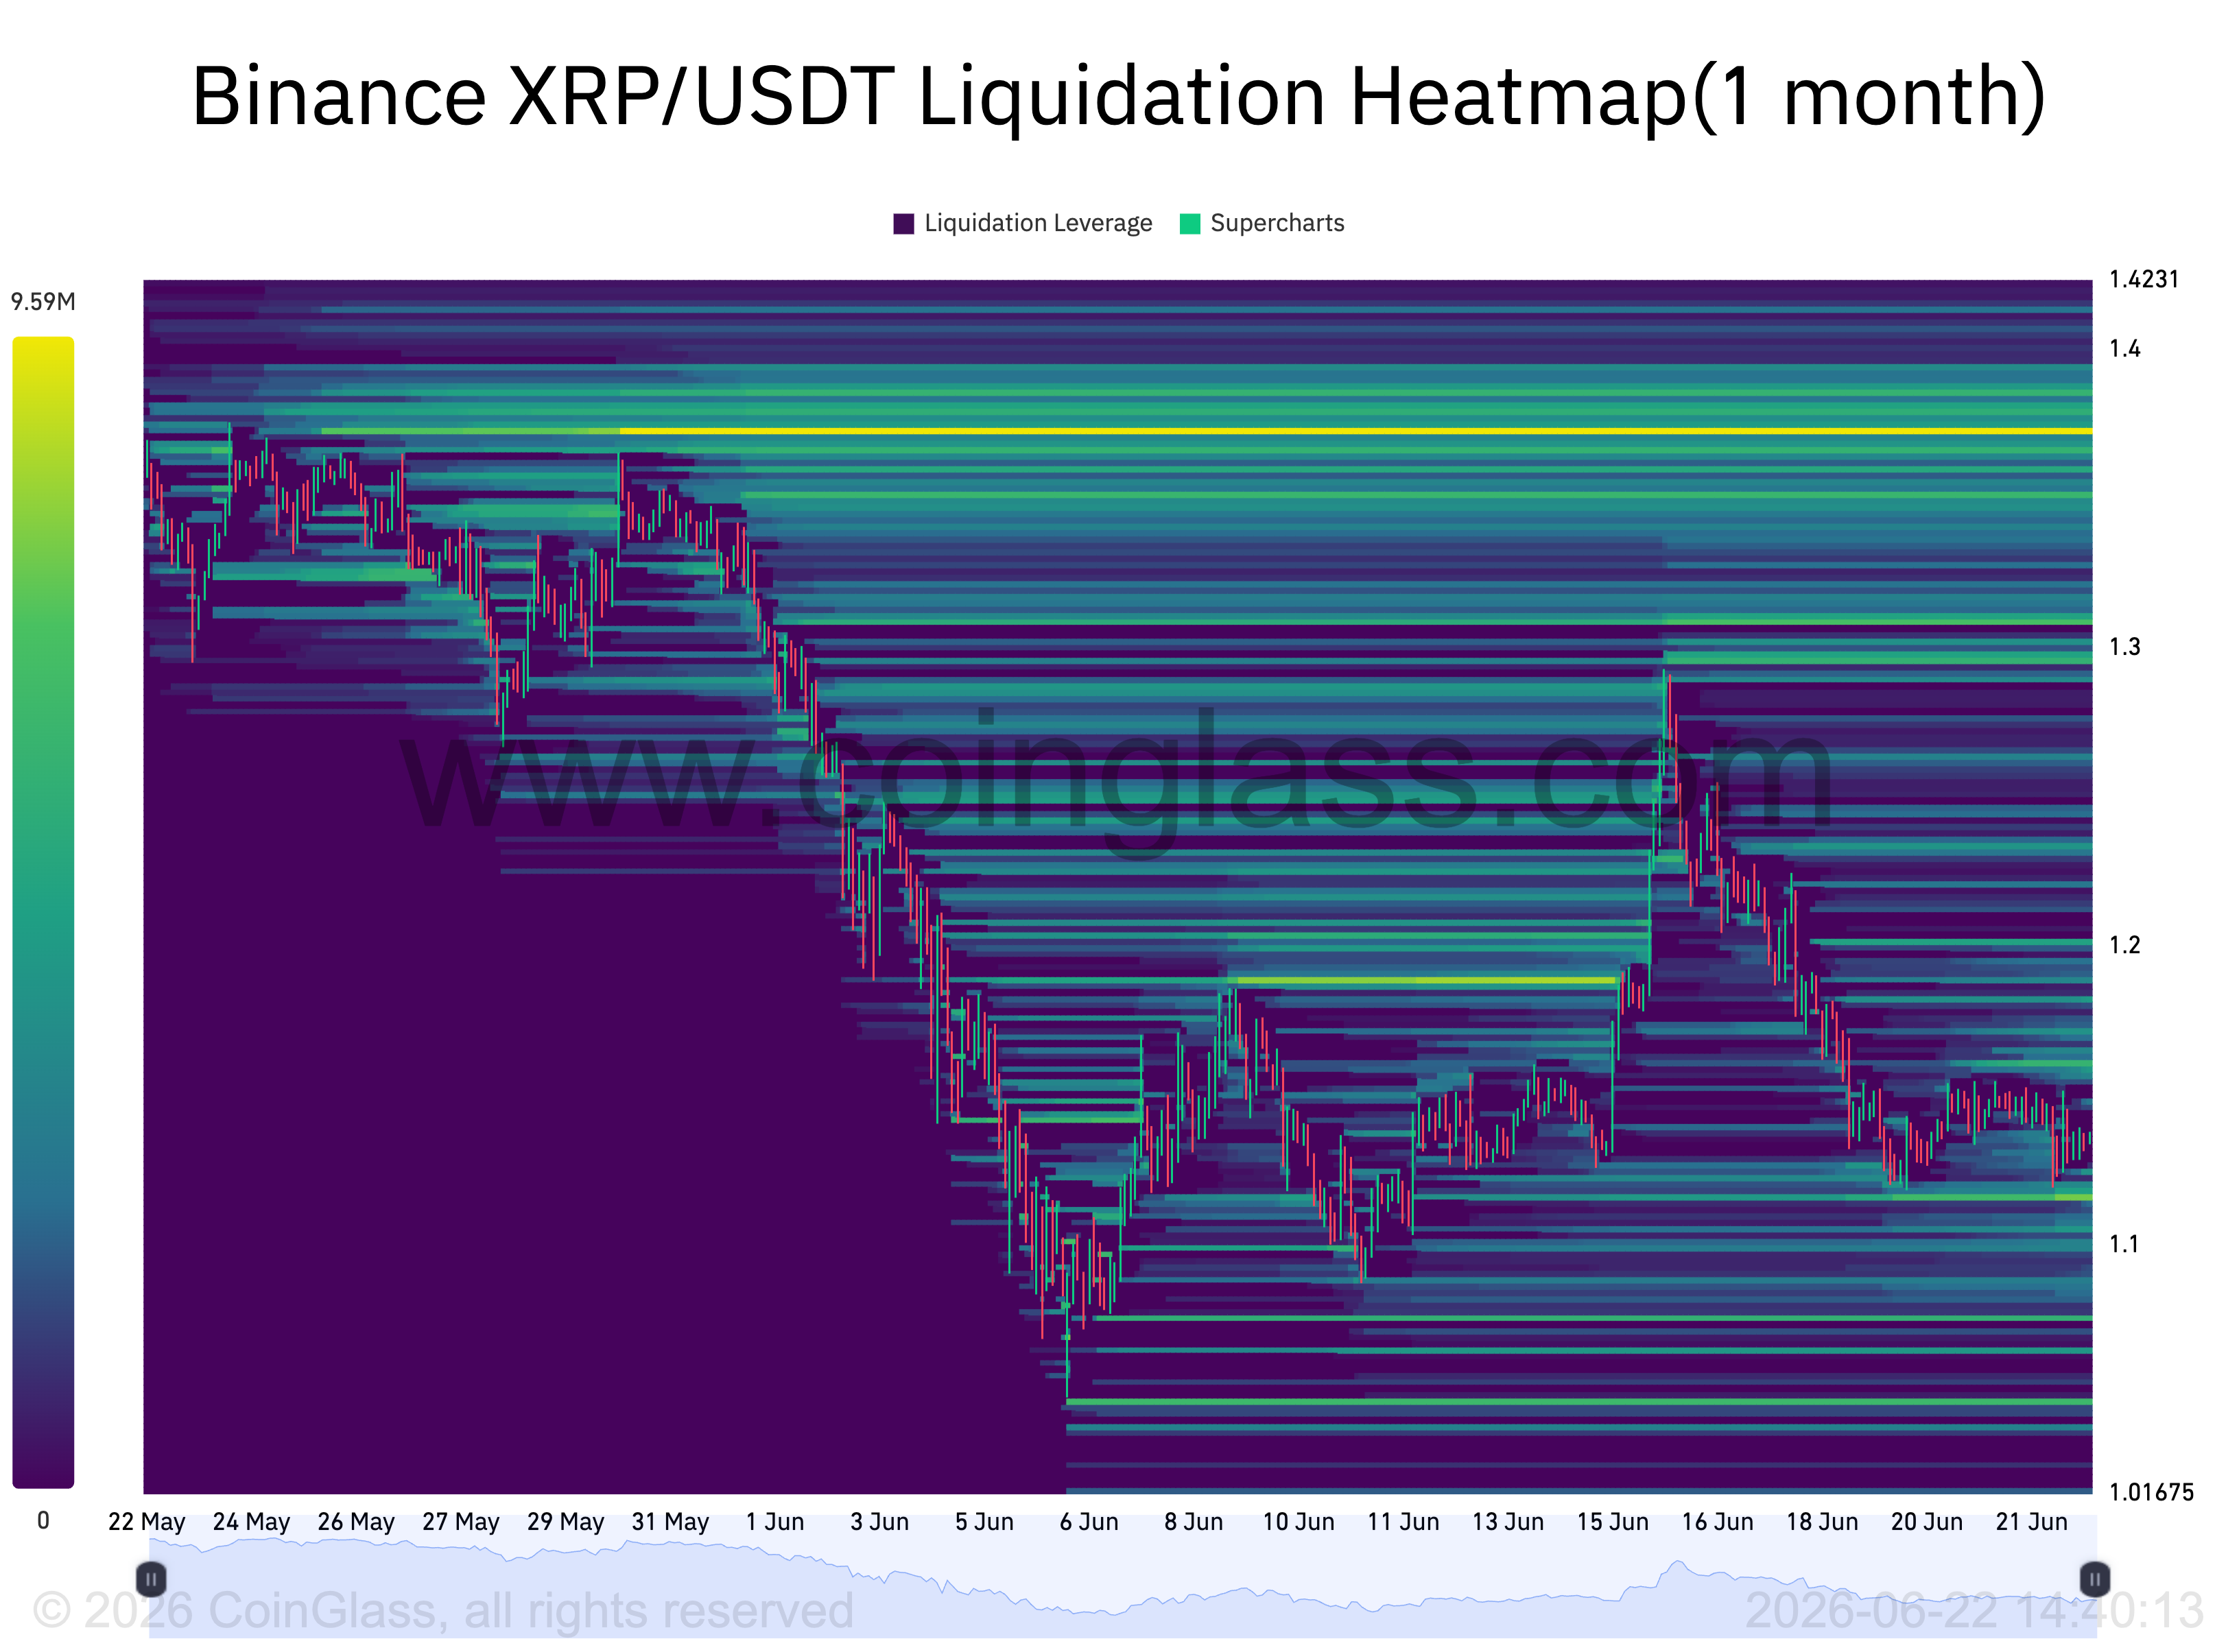
XRP/USDT 1-month liquidation heatmap. Source: CoinGlass
Liquidation heatmaps often highlight where prices may move to flush out crowded leveraged positions.
Short sellers positioned above the spot price could be forced to buy back their exposure if XRP starts rebounding from the current $1.13 price levels, adding fuel to a move toward the $1.39–$1.40 area.
XRP may rebound toward $8: Analyst
A separate long-term chart from analyst Cryptollica suggests that XRP’s next rebound could be part of a broader bottoming setup.
The chart shows XRP’s 10-day RSI hovering near the low-30s, close to the level that has historically appeared around major accumulation phases.

XRP/USD 10-day chart. Source: TradingView
“In 13 years, XRP has only been this washed out 3 times,” Cryptollica said in a Sunday post, adding:
“The first 2 times, the crowd laughed, ignored it, and only understood the setup after price had already left.”
Cryptollica’s chart also shows XRP trading above the lower boundary of a giant ascending channel, a long-term support line that has connected multiple macro lows since 2017.
Related: XRP whale wallet withdrawals top 720M as risk-adjusted return data points to opportunity
That trend line currently sits near $0.75, meaning XRP could still see one more downside sweep before a larger recovery begins. In previous cycles, tests of this support area preceded major upside expansions.
XRP could first retest the channel support before entering a broader bull-market phase, with the channel’s upper boundary putting a long-term target near $8 in focus if the pattern plays out again.
Read the full article here


