






Bitcoin starts the week with new August highs as traders weigh the impact of crunch US inflation data.
Key points:
- US CPI and PPI data comes amid fluctuating bets on Federal Reserve interest-rate hikes in 2026.
- The Japanese yen remains at the forefront as it creeps back toward the key 160 level against the US dollar.
- Bitcoin (BTC) traders see the area around $65,800 as crucial for bulls after BTC/USD hits new month-to-date highs.
- Larger Bitcoin wallets contrast with retail holders after a conspicuous two-month accumulation spree.
- Baskets of onchain indicators still see the bear market continuing in the second half of the year.
CPI, PPI data comes at crucial time for Fed
Key US inflation data is due as markets shift their expectations of Federal Reserve interest-rate policy.
The July prints of the Consumer Price Index (CPI) and Producer Price Index (PPI) will be released on Wednesday and Thursday, respectively.
The timing of the release is important — recent US inflation cues have given mixed signals to Fed watchers, while resolution of the US-Iran war likewise remains far from certain. The latter has implications for CPI in particular, given oil’s price sensitivity to events around the Strait of Hormuz shipping route.
“Crude oil prices remain caught between opposing forces, as markets assess the possibility of a breakthrough over the Strait of Hormuz against Iran’s conditions for reopening the strategic waterway,” Sugandha Sachdeva, founder of New Delhi-based research company SS WealthStreet, told Reuters on Monday.
CFDs on US WTI crude oil one-hour chart. Source: Cointelegraph/TradingView
Last month’s CPI and PPI results both surprised to the downside, with the former seeing its largest monthly decline since April 2020. Nonfarm payrolls numbers last week continued the trend, showing weaker-than-expected labor-market conditions.
Both bolstered odds of a more dovish Fed going forward, with markets switching from a 0.25% rate hike probability to a continued pause as the most likely outcome at its Sept. 16 meeting. CME Group’s FedWatch Tool showed a 56% chance of a pause as of Monday.
“A week ago, market-implied odds strongly favored a rate hike at the Fed’s next meeting in September. Those odds now slightly favor the Fed keeping rates on hold, with just one hike before pausing well into next year,” trading resource Mosaic Asset Company wrote in the latest edition of its newsletter, The Market Mosaic.

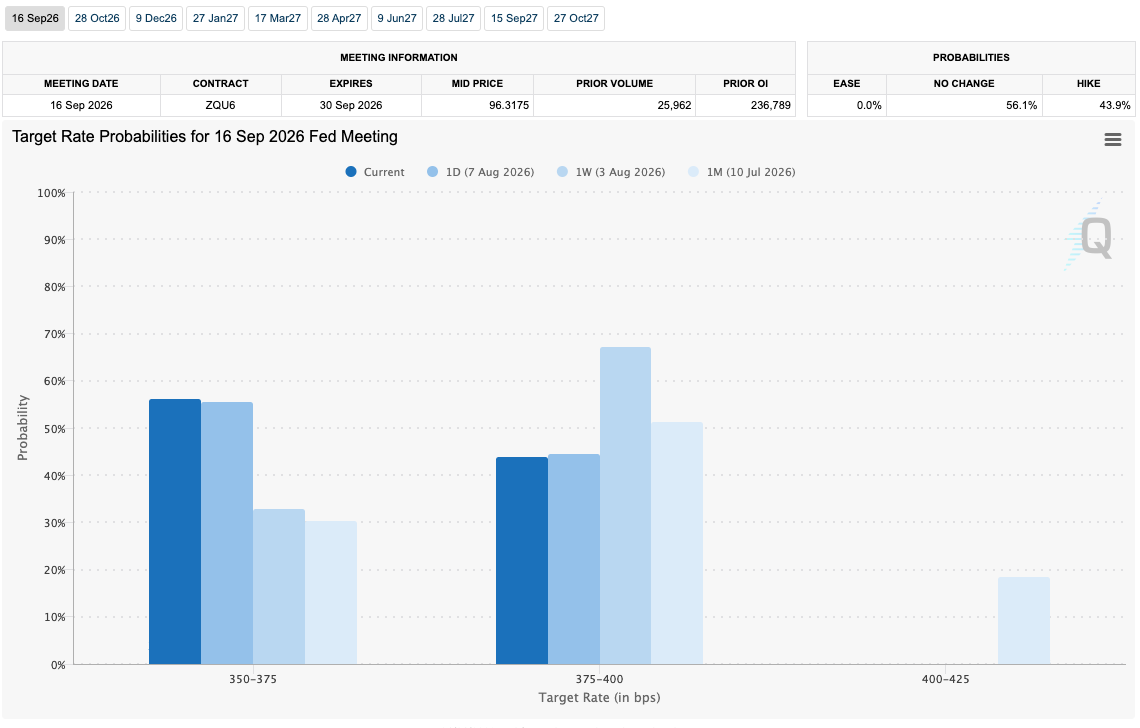
Fed target rate probability comparison for September FOMC meeting (screenshot). Source: CME Group
Mosaic added that last week’s ISM Manufacturing and Services data pointed to the US economy “holding up just fine,” despite the data sparking concerns over signs of future “stagflation” — rebounding inflation gauges combined with slow economic growth and rising unemployment.
Yen reverses days after US intervention
The US role in manipulating the Japanese yen remains a key point on the radar for traders worldwide after the first joint US-Japanese intervention since the late 1990s.
After JPY/USD weakened to its lowest levels since 1986 at the start of August, the New York Fed, acting on behalf of the US Treasury, purchased yen using euros via the Exchange Stabilization Fund, or ESF, a stockpile of foreign exchange reserves.
At the time, Treasury Secretary Scott Bessent hinted that the door was open to repeat interventions in future.
“We strongly support Japan’s decisive market and monetary steps to correct the substantial undervaluation of the yen,” he wrote in a post on X.
In the interim, however, the yen has begun to weaken again after initially strengthening to around 156 per dollar. At the time of writing, it was back above 158.50, closing in on the key 160 level once more.
Analyzing the history of yen interventions, Robin Brooks, a senior fellow in economic studies at the Brookings Institution, warned that the mechanism would be unable to change the status quo on its own.
“You’d think — given everything that’s getting thrown at markets — that the yen would have risen more than during the previous two intervention episodes we saw earlier this year, but that’s not true,” he wrote in a blog post on Friday. He said:
“Price action is comparable to the NY Fed’s rate check on Jan. 23, which came just ahead of Japan’s Feb. 8 general election. That’s underwhelming and supports my general take that this intervention – like past ones – will fail to stop the Yen’s weakening trend.”

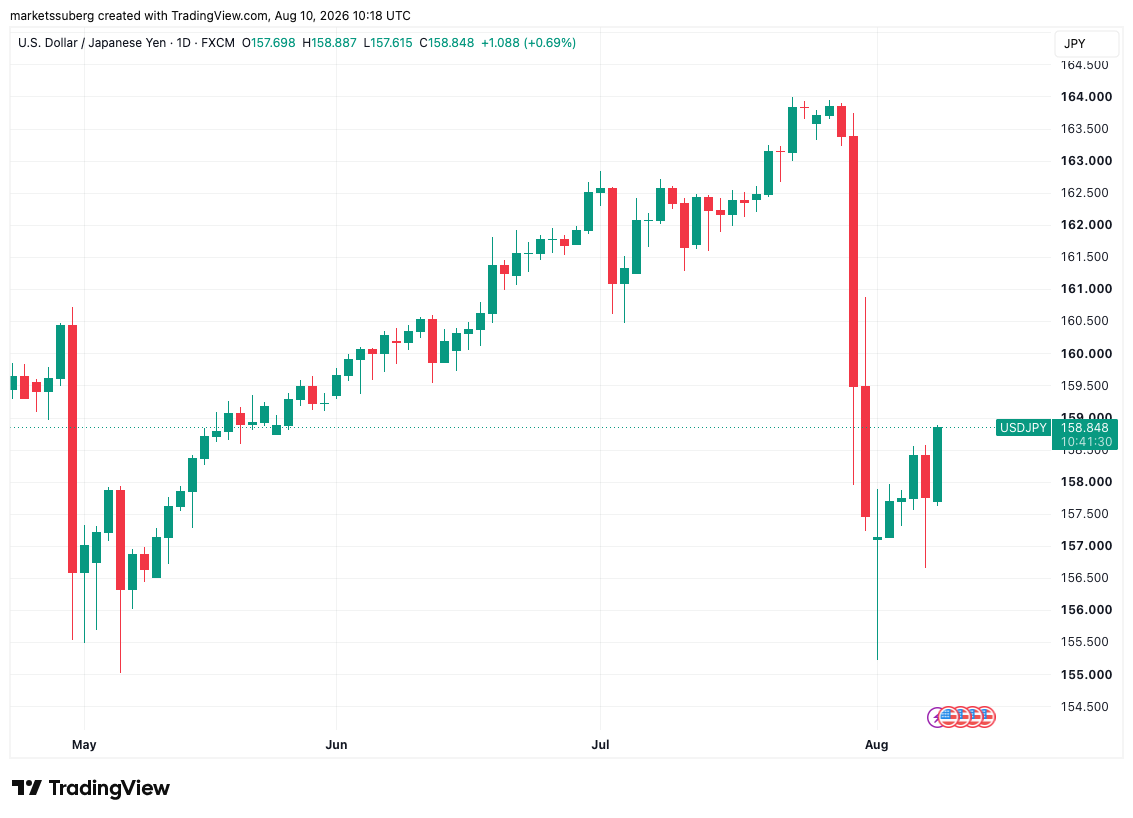
USD/JPY one-day chart. Source: Cointelegraph/TradingView
Previously, Cointelegraph reported on the longer-term implications for the yen carry trade, a key liquidity consideration for crypto and risk-asset traders.
“For global markets, the question is less about any single intervention and more about whether higher Japanese yields alter the incentives for domestic investors to allocate capital overseas,” trading company QCP Capital commented last week.
Trader eyes BTC bullish divergences with $65,800 now key
Bitcoin saw new month-to-date highs of $65,420 into Sunday’s weekly close, subsequently consolidating progress as TradFi markets returned.
Data from TradingView still showed BTC/USD acting in a stubborn range, with the 50-month exponential moving average (EMA) in place as resistance overhead at $65,827.
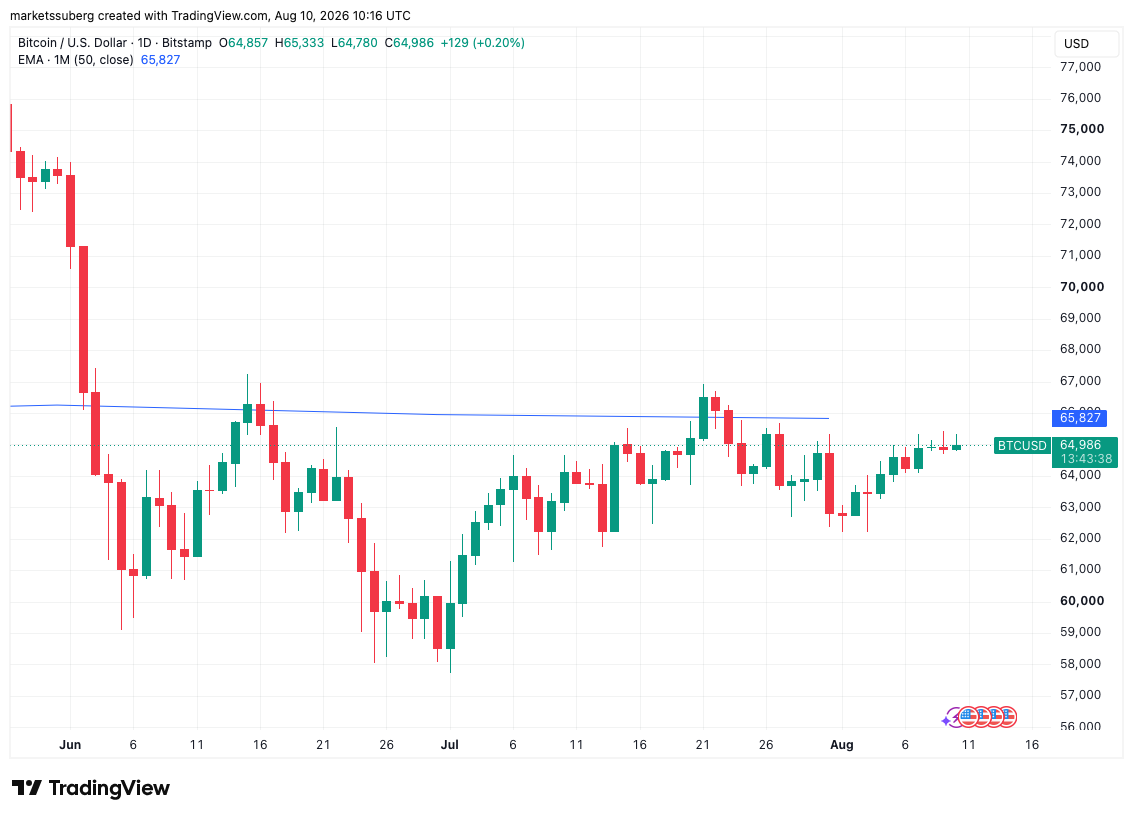
BTC/USD one-day chart with 50-month EMA. Source: Cointelegraph/TradingView
In his latest market analysis, crypto trader Michaël van de Poppe saw three BTC price breakout signals nonetheless locking in on classic price indicators. The moving average convergence/divergence (MACD) and relative strength index (RSI) both have “strong” bullish divergences on both three-day and one-week time frames, he reported at the weekend.
Alongside a chart showing the divergences, in which the indicators set higher lows while price makes lower lows, Van de Poppe put $65,800 as the key target for bulls to break through next.
“All in all, if $65,800 breaks (which is the crucial weekly level), I expect to see a volatile move upwards as short-side liquidity will be forced to move out of its position after this consolidation,” he said.

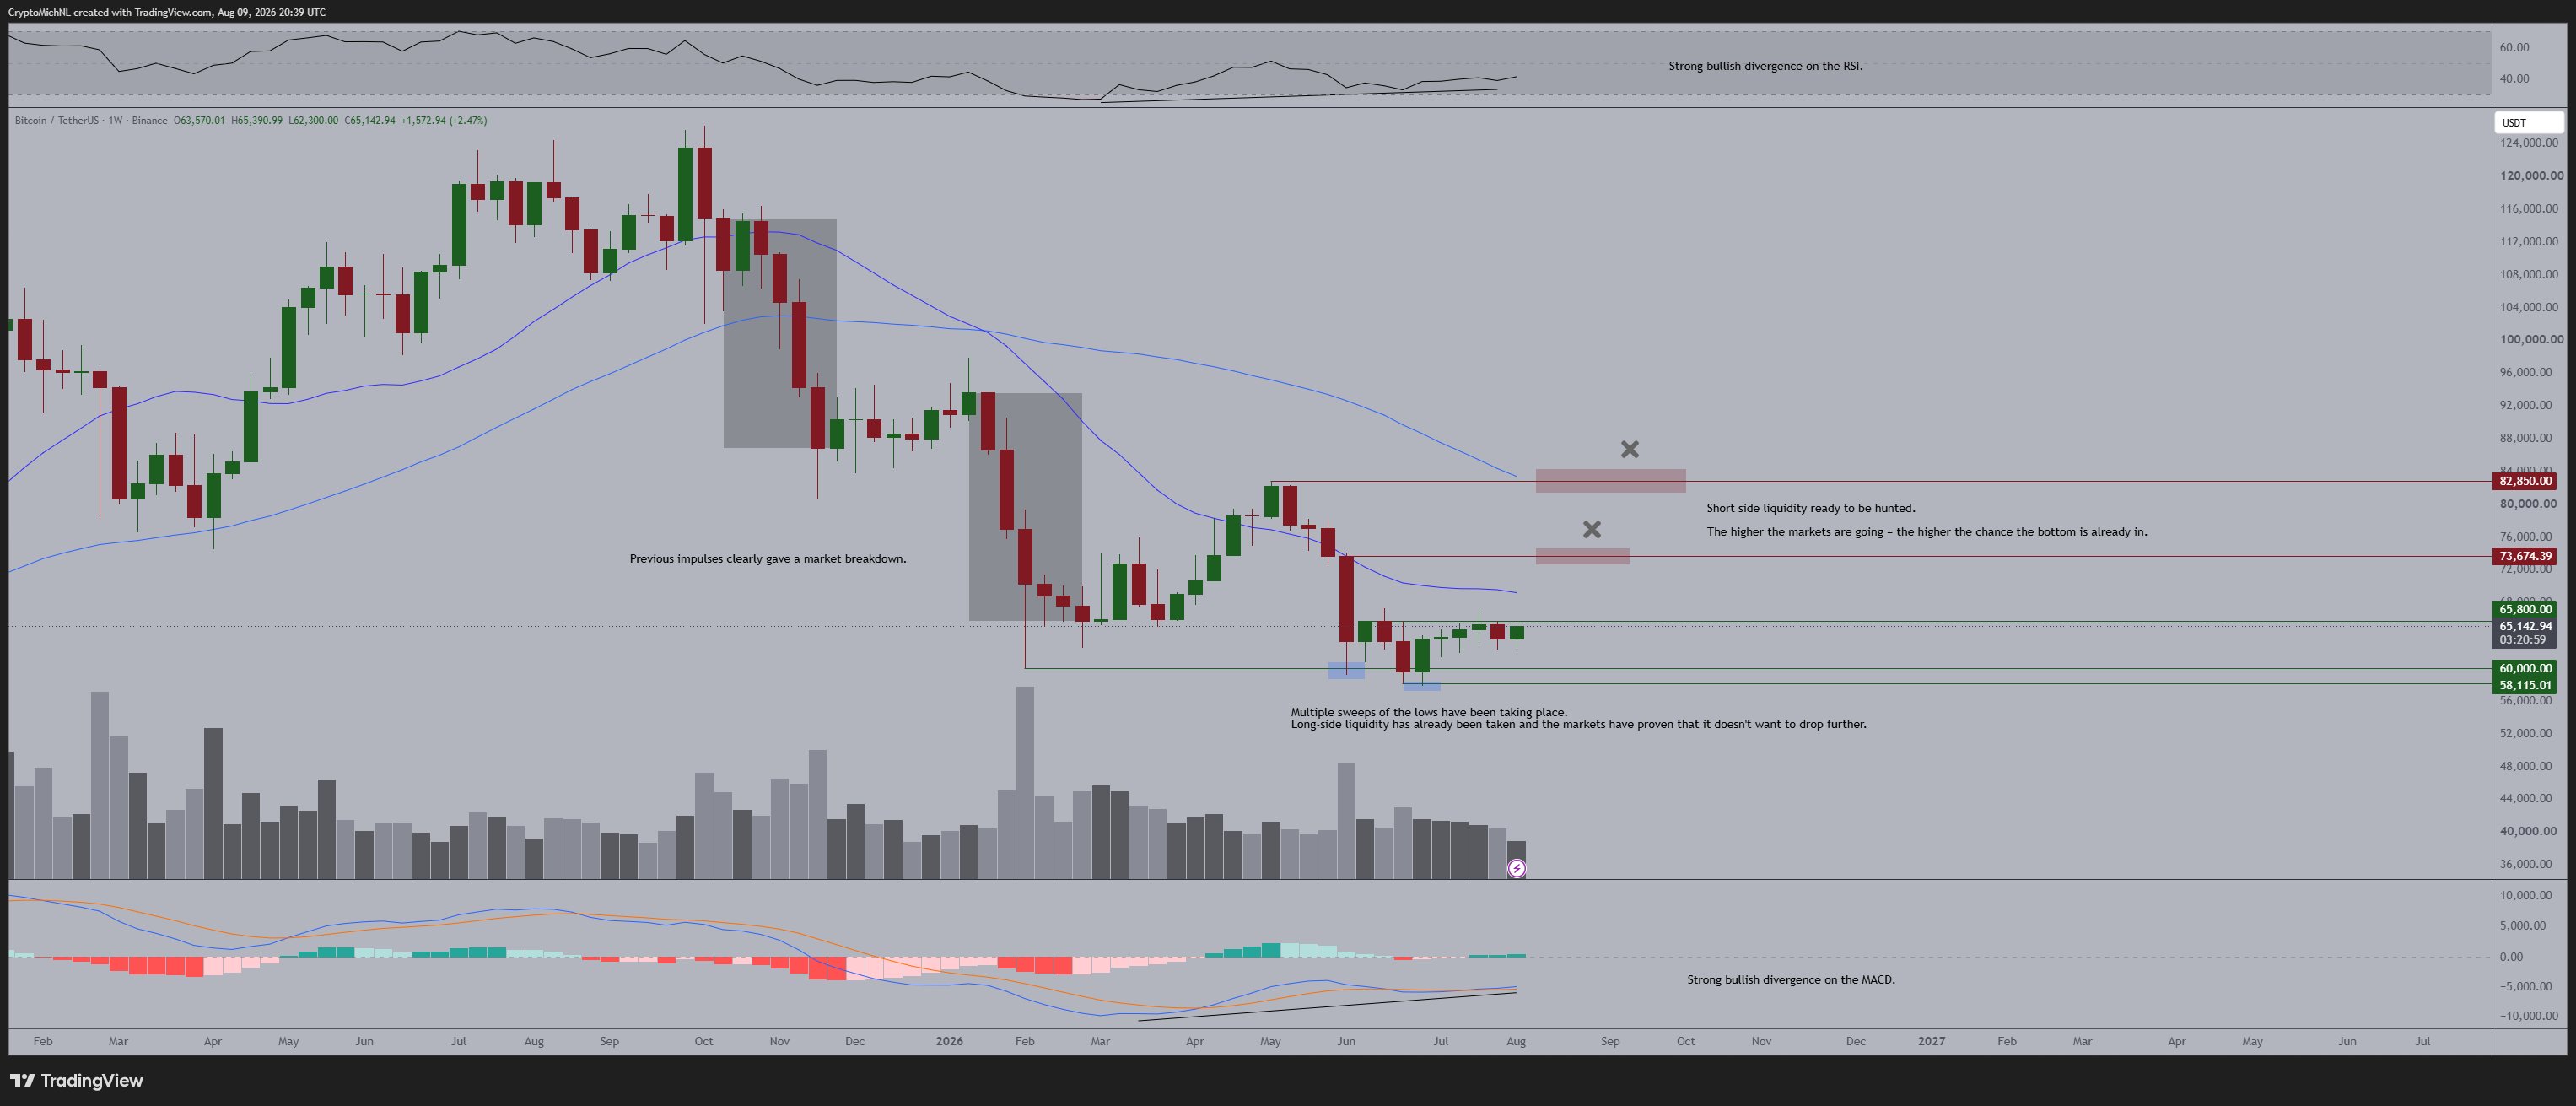
BTC/USDT one-week chart with MACD, RSI data. Source: Michaël van de Poppe on X.com
The latest exchange order-book data from CoinGlass shows liquidity building either side of spot price, with $65,800 likewise a key area for potential short-position liquidations. The new August highs appeared not to catch traders by surprise, with 24-hour cross-crypto short liquidations at $53 million at the time of writing.

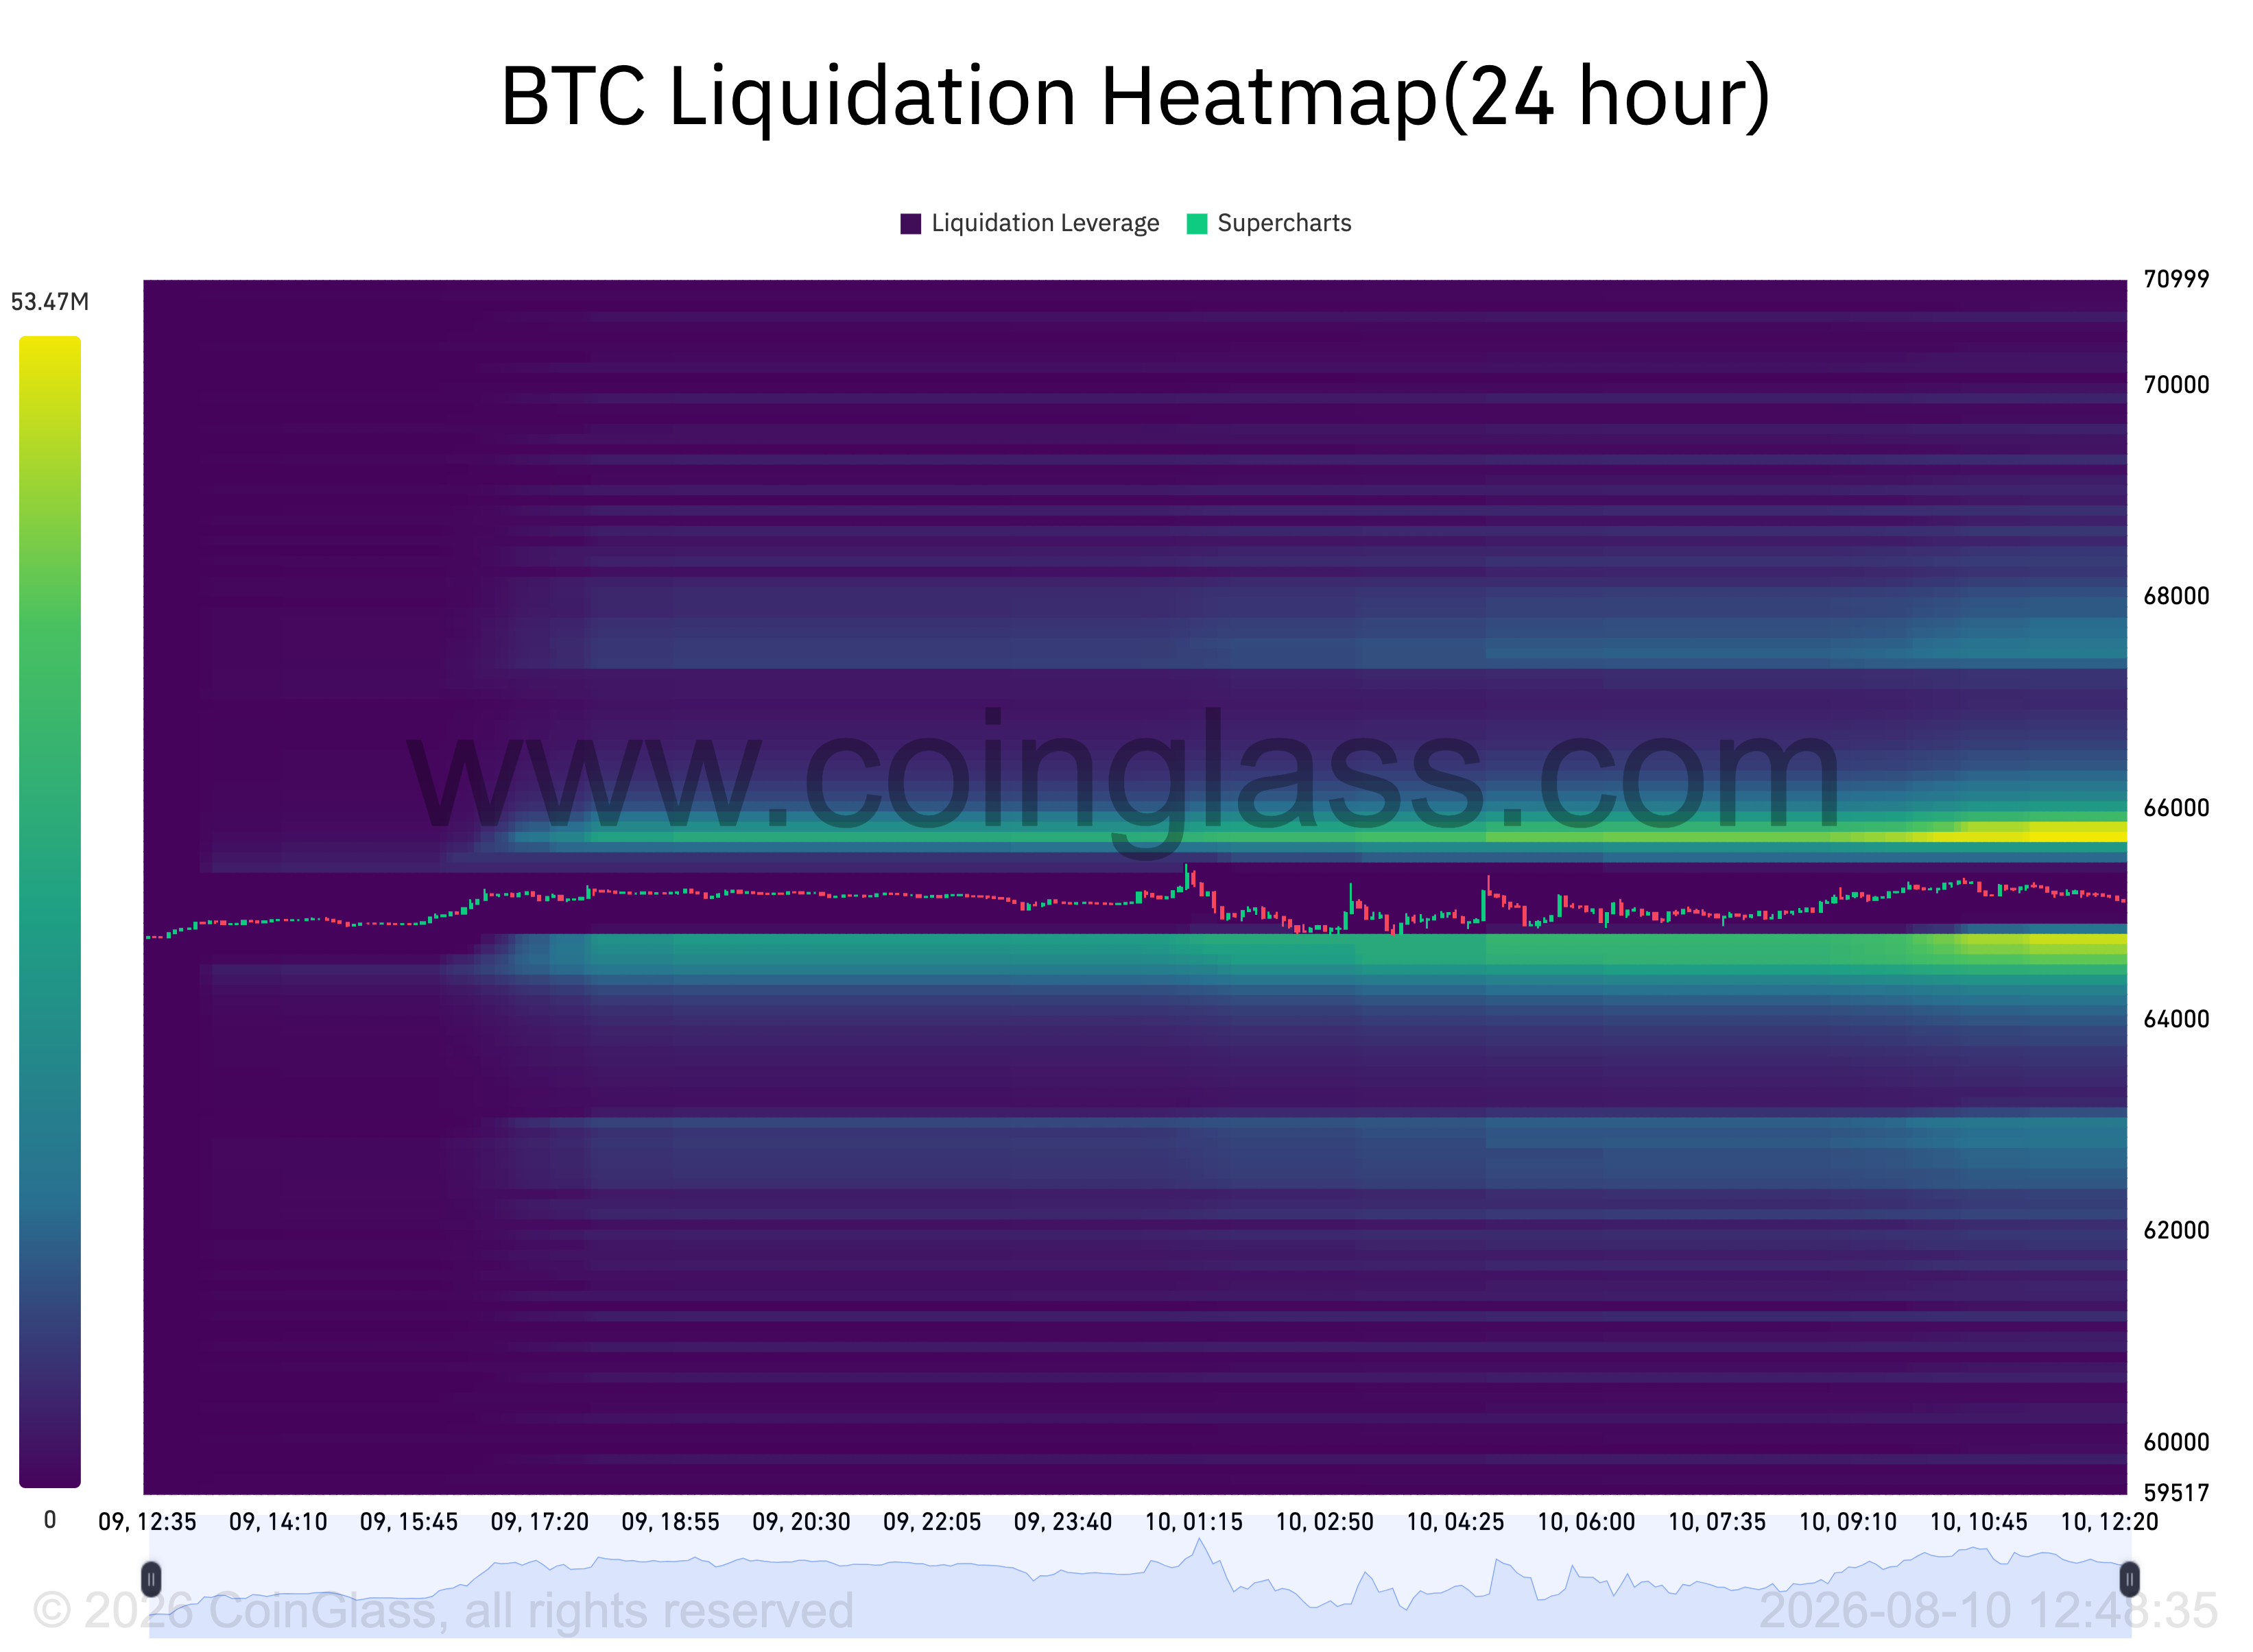
BTC liquidation heatmap. Source: CoinGlass
Andrew Kamsky, a contributor to onchain analytics platform CryptoQuant, eyed a breakout from a falling wedge construction on the daily chart. He suggested that a “decision window” could determine the fate of the range by Aug. 17.
“A rejection between $66.4K and $66.8K, followed by a series of higher lows, could begin forming an ascending triangle and create another opportunity for an upside breakout. A move back inside the wedge would weaken the bullish setup, while a crack below wedge support would invalidate it and suggest that the market is forming a different structure,” he said.
As an upside target, Kamsky gave $72,000 as a “possible scenario.”

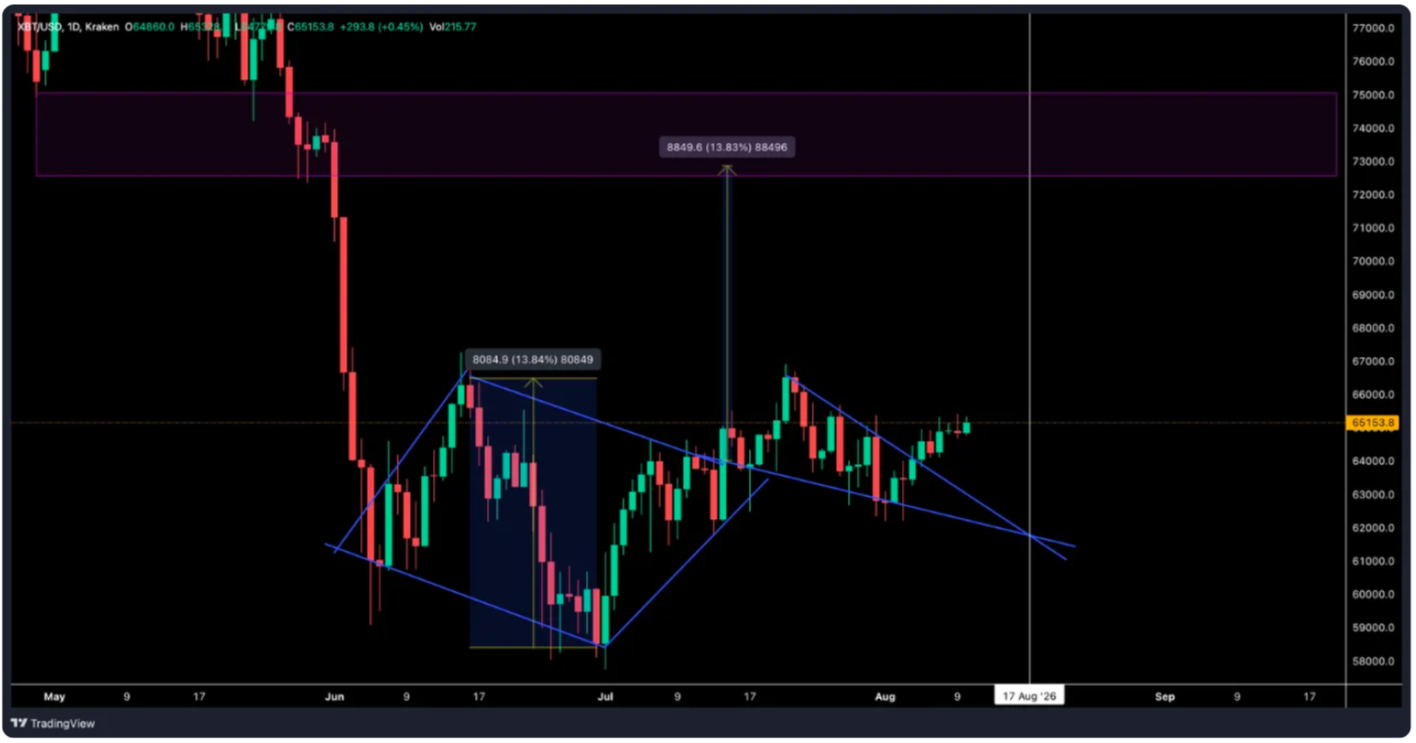
BTC/USD one-day chart (screenshot). Source: CryptoQuant
Large BTC investor accumulation hits multimonth high
Larger Bitcoin investors are drawing attention to themselves this week as new analysis flags a “sharp shift toward accumulation.”
Data from CryptoQuant shows a rapid increase in Bitcoin exposure involving addresses holding more than 10,000 BTC. On a 60-day rolling basis, the cohort’s balance increased by 46,420 BTC on Aug. 9, marking the largest uptick since March 15.
“More notably, the latest reading is nearly double the 23,238 BTC accumulation peak recorded in mid-March, pointing to a significant acceleration in activity among the largest balance group,” CryptoQuant commented.
More recently, larger hodlers have begun to diverge from smaller wallets traditionally associated with retail investors. After initially accumulating through July, addresses holding between 0.1 BTC and 1 BTC distributed around 9,700 BTC for the 60 days through Aug. 9.
“The divergence is notable because it shows two very different positioning trends developing simultaneously: the largest BTC balance cohort is increasing exposure while smaller holders are reducing it,” CryptoQuant said, noting the timing of the accumulation coinciding with the upcoming US CPI and PPI data releases.

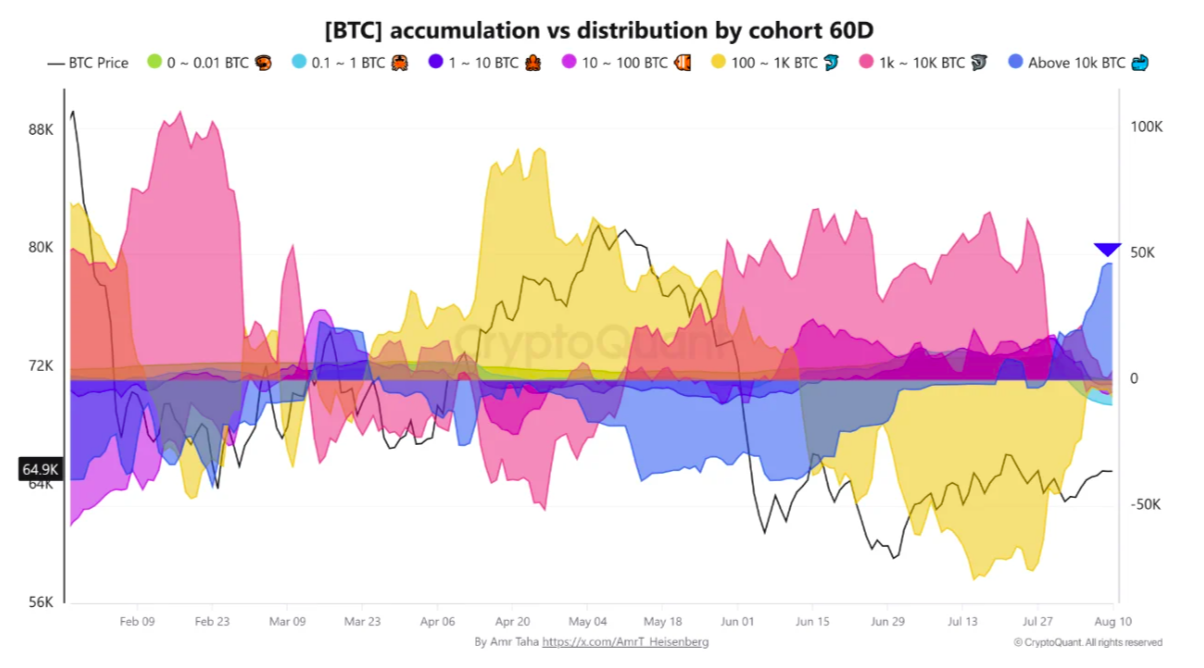
Bitcoin accumulation and distribution by cohort. Source: CryptoQuant
Last week, Cointelegraph reported what CryptoQuant called “strong accumulation” between $62,000 and $65,000, with around 0.7% of the total BTC supply — around 155,000 coins — last moving onchain within that range. At the same time, a record divergence between spot and futures trading volumes has placed doubt over Bitcoin’s ability to recover lost ground in the current climate.
Commenting on daily spot-market turnover relative to market size, Rafael Schultze-Kraft, cofounder of onchain analytics platform Glassnode, described spot markets as “virtually dead.”
“Daily spot turnover ratio sits at just 0.32%, the lowest level in our data, while dollar volume is down ~64% YoY. Textbook apathy. A healthier move higher needs participation to come back,” he told X followers last week.

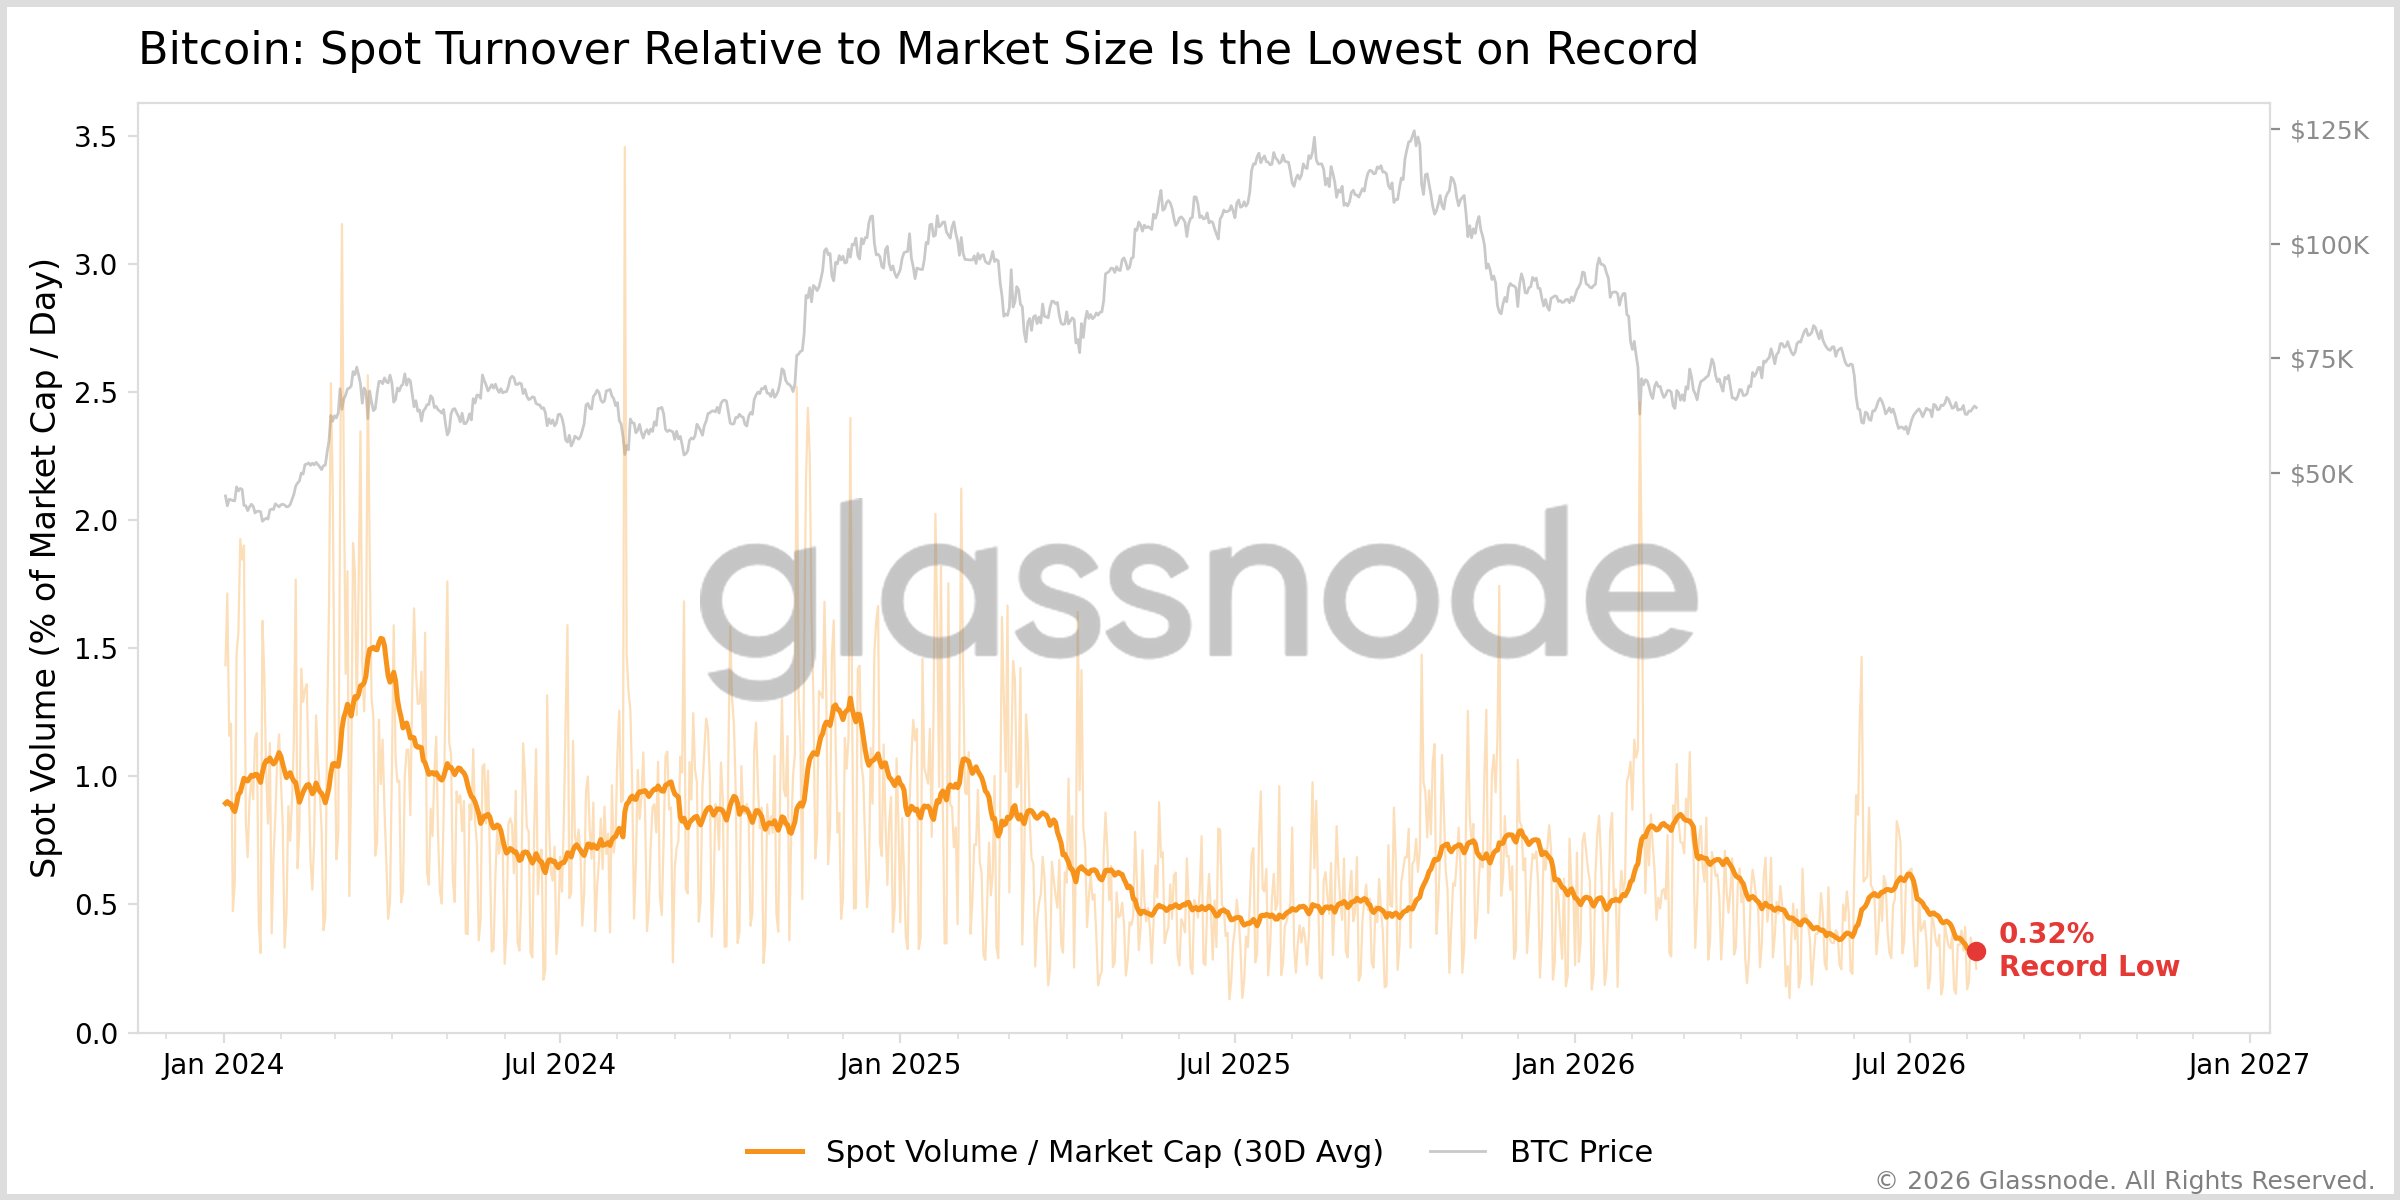
Bitcoin spot turnover data. Source: Rafael Schultze-Kraft on X.com
Indicators see Bitcoin bear market continuing
On aggregate, Bitcoin onchain metrics and associated price gauges still demand cooler conditions before a reliable long-term reversal hits.
Related: BIP-110 ends with a whimper, CLARITY vote punted: Hodler’s Digest, Aug. 9
In separate research, Schultze-Kraft revealed a record “capitulation” phase in a basket of 45 price indicators which make up Glassnode’s Bitcoin Cycle Position Heatmap. This compares market health across four-year BTC price cycles, with current conditions characteristic of the final stages of the bear market.
“Today it sits in its coldest stretch since FTX: late in the bear, but not yet the unanimous deep blue that previously marked a floor,” Schultze-Kraft commented on the heatmap’s latest readings last week.
A similar compilation from CoinGlass, which it dubs its Bull Cycle Peak Indicators, currently sits at 32% toward its ideal “sell” zone.

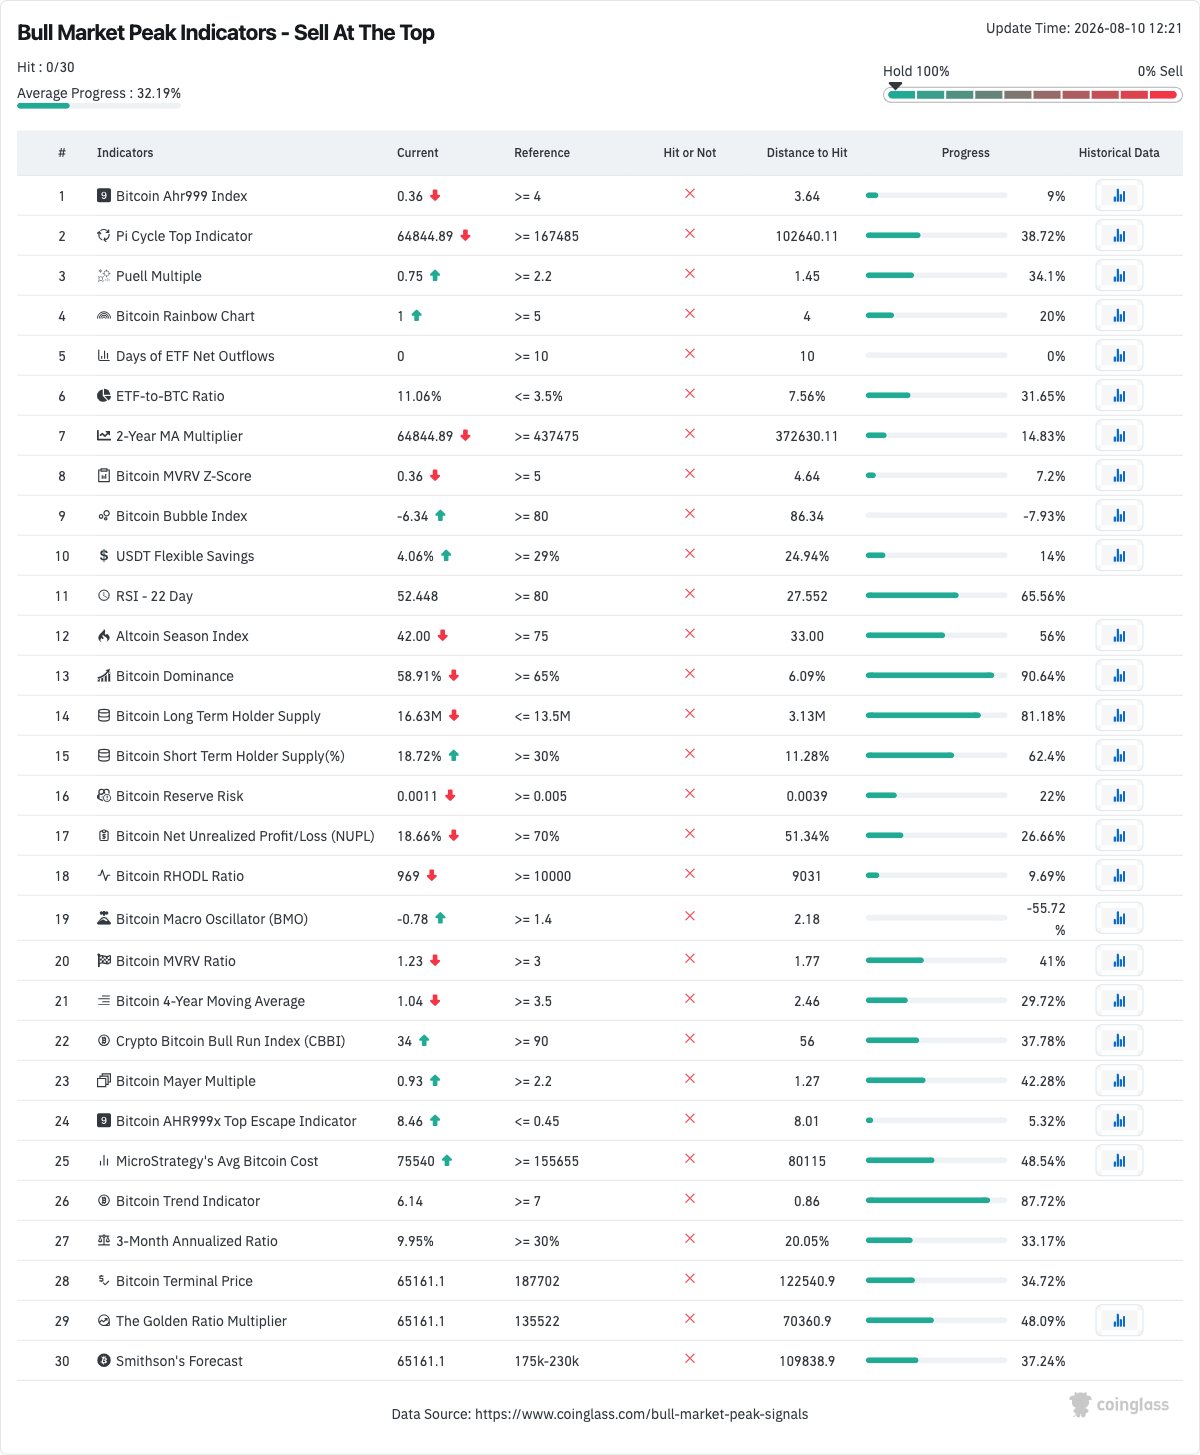
Bitcoin Bull Market Peak Indicators. Source: CoinGlass
The data ties in with the views of an growing number of Bitcoin traders looking at historical patterns to determine BTC price performance for the rest of 2026. This week, trader and analyst Rekt Capital drew particular comparisons to the 2022 bear market.
“Bitcoin is forming Lower Highs here relative to the July upside wick In 2022, August actually developed a Higher High relative to the preceding July,” its weekend post said.
Rekt Capital reiterated Bitcoin’s current inability to reclaim the 50-month exponential moving average (EMA), currently at $65,827 — a classic predecessor of a final bear-market capitulation.
“No matter the structure however, 4 years ago Bitcoin positioned itself for a bearish retest of the 50 Month EMA (purple) to reject and drop lower later. Today as things stand, Bitcoin is technically positioned for the same thing,” he added.

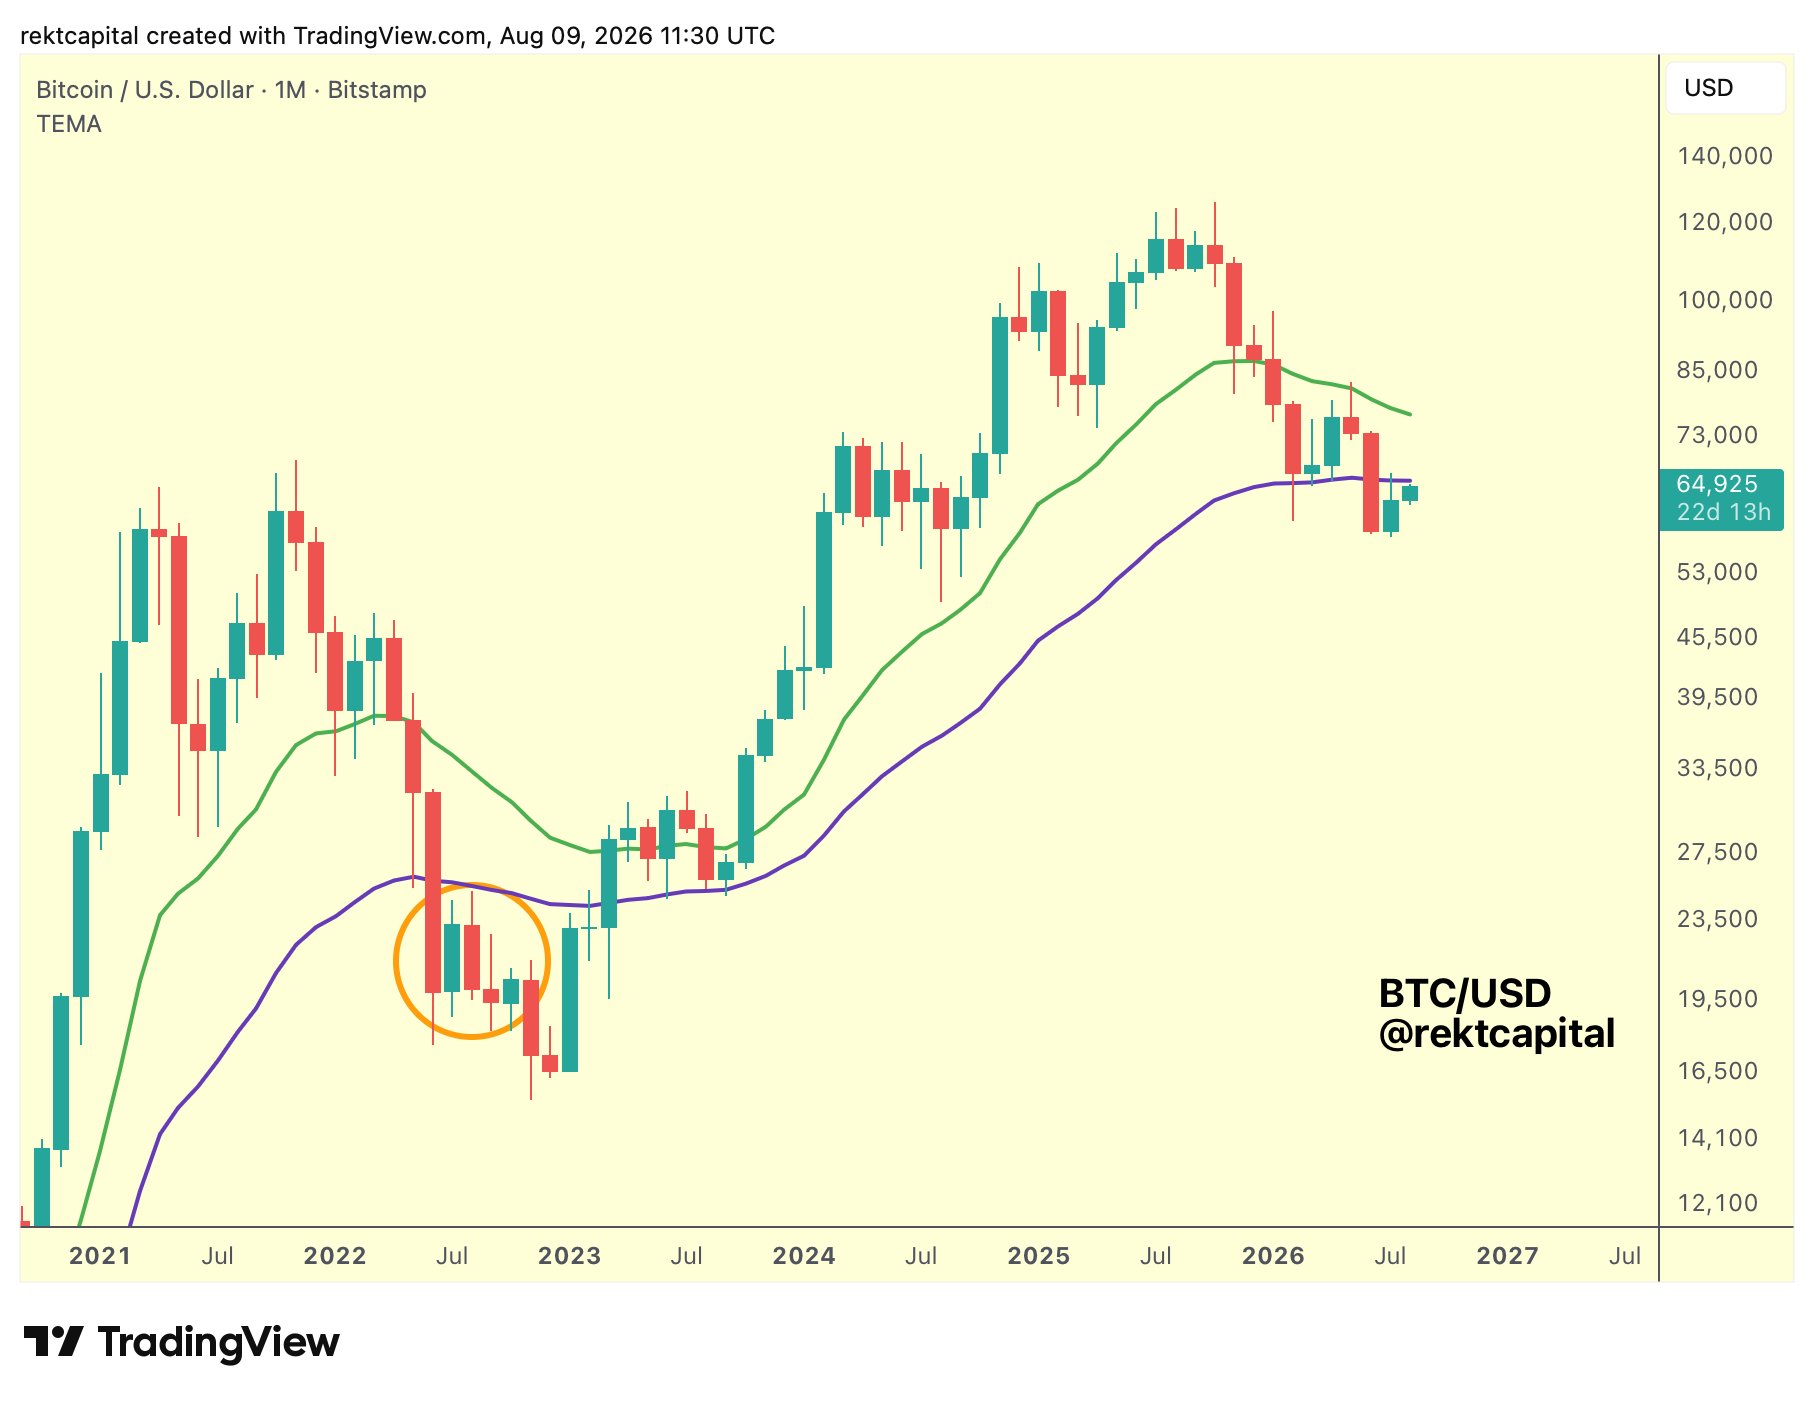
BTC/USD one-month chart with 21, 50 EMA. Source: Rekt Capital on X.com
Read the full article here